Wheat Industry News
News and Information from Around the Wheat Industry Speaking of Wheat “When we went to ethanol production, we had to have significantly more acres of corn and soybeans to a certain degree with biodiesel. You go back to 2006 and 2007, I remember traveling around the states telling Oklahoma wheat producers, ‘You have got a […]
Wheat Industry News
News and Information from Around the Wheat Industry Speaking of Wheat “The team had a chance to visit all aspects of the supply chain, from farm to export elevator, and learn about the FGIS inspection process, giving them a sense of how US wheat quality is ensured throughout the way. These visits provide reassurance to […]
Latin American Markets Take Advantage of Soft Red Winter Wheat Value

Mexico, Central America, the Caribbean, and South America represent a substantial portion of U.S. wheat sales, accounting for around 33% of all U.S. wheat exports. Due to proximity and sophisticated, quality-focused markets, Latin America and the Caribbean see competitive advantages in U.S. wheat supplies. In fact, while total demand for U.S. wheat slowed the last […]
Wheat Industry News

News and Information from Around the Wheat Industry Speaking of Wheat “The abrupt termination of the implementation of the Black Sea Grain Initiative is a matter of grave concern. Global food security should not become a casualty of war. People in poor countries struggling with food and energy price inflation stand to be hit hardest […]
Historically Low PNW HRS Export Basis Demonstrates Buying Opportunity

As the geopolitical conflict between Russia and Ukraine comes back into focus following the attacks on port infrastructure in the Ukrainian Black Sea ports of Odesa, Chornomorsk, and the terminals along the Danube River, wheat market volatility remains an ever-present risk. Despite the recent swings, export basis trends can help provide clues to potential buying […]
Wheat Industry News
News and Information from Around the Wheat Industry Speaking of Wheat “The big news in wheat was the hard red winter number — shock-and-awe for USDA to increase it that much. The average trade guess was 532 million bushels, so the number was way above what anybody anticipated. We had a broad-based increase in yields, […]
Wheat Industry News

News and Information from Around the Wheat Industry Speaking of Wheat “The international [grain] price in Ukraine will be on the level of the cost of production. Harvested grains and oilseeds will be level of 62 million (tonnes), exports about 40 million. We have only three seaports operating at capacity and [under the ‘fragile agreement’ […]
Surprising USDA Reports Top-Off a Volatile Week
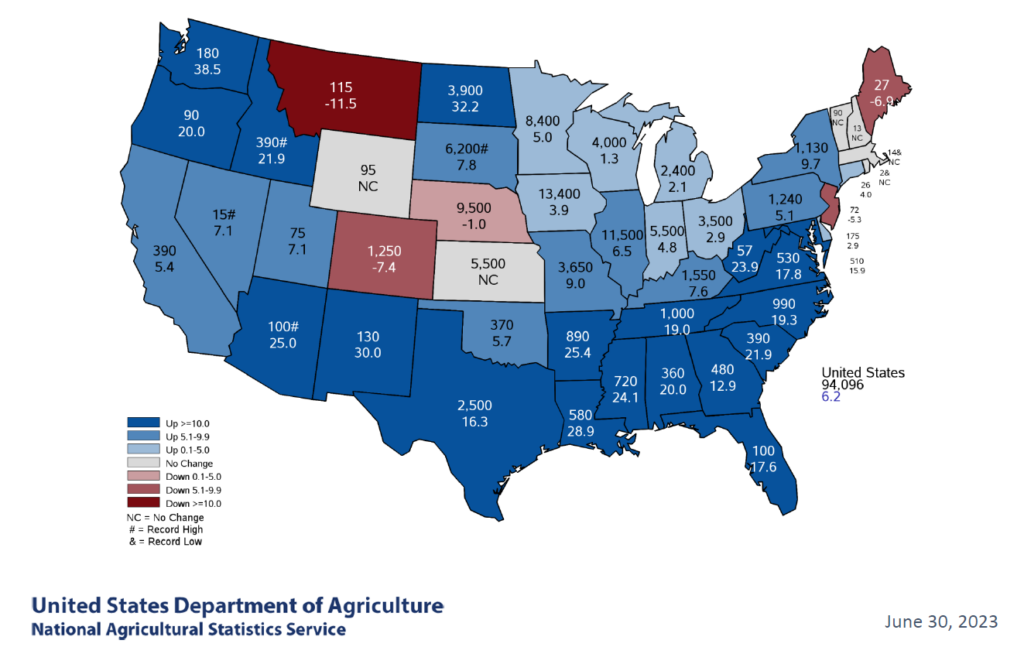
The June USDA reports on Acreage and Stocks, released on June 30, 2023, made a significant splash on grain markets after an already volatile week. With no new fundamentals to trade, wheat prices found little insulation from movements in corn and soybean markets. From June 21 to June 30, Chicago Board of Trade corn futures […]
Wheat Industry News

News and Information from Around the Wheat Industry Speaking of Wheat “Without a trade agenda that also advances U.S. economic interests by addressing barriers to U.S. exports through free trade agreements, the United States will lose influence globally. Other countries welcome U.S. products and benefit from the two-way relationship that free trade agreements promote. The […]
The Wheat Marketing Year in Review

Final export commitment data for marketing year (MY) 2022/23 that ended May 31 is now available, providing an overview of the year’s export and demand trends. In this article, we will look back on the MY 2022/23 demand trends and current MY 2023/24 data to provide context for the year to come as the world […]