Dry Bulk Freight Rates Riding Rough Seas

This was supposed to be the year dry bulk freight vessel owners turned a profit, Jay O’Neil, a commodities consultant and author of a weekly transportation report recently commented. And U.S. Wheat Associates (USW) shared similar thoughts early in 2021. Instead, S&P Global Market Intelligence noted recently that freight rates for dry bulkers have fallen […]
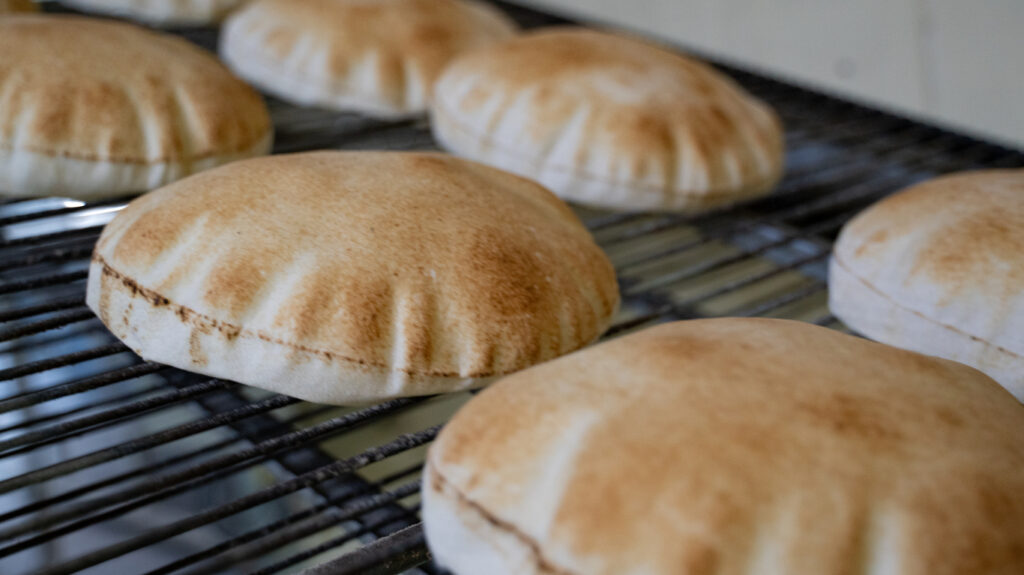
USW’s Online Baking Program Putting U.S. Wheat ‘Top of Mind’ in South America

An online training series developed by U.S. Wheat Associates (USW) in the early days of the COVID pandemic continues to have success in its effort to educate South American bakers and millers about the value and quality of U.S. wheat. Specifically, the Online Baking Certification program promotes baking methods and processes that highlight all six […]
Export Opportunities Await U.S. Wheat, But ‘It’s Complicated’
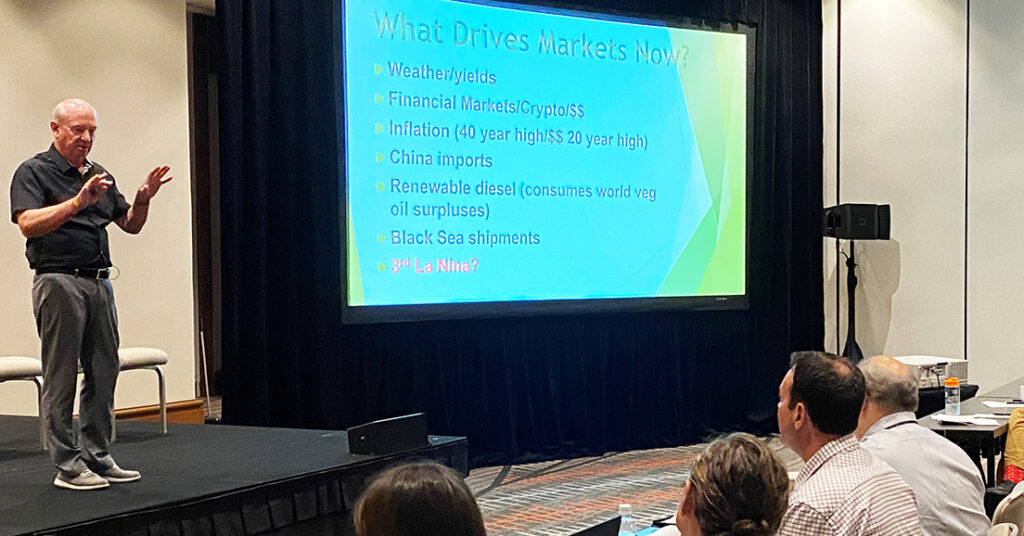
Before providing a simple and straightforward description of the global wheat and grain markets, Mike Krueger paused to consider a handful of variables facing importers, exporters and producers. Then he used a word that is opposite of simple and straightforward. “It’s complicated,” Krueger told those attending the 2022 U.S. Wheat Associates (USW) World Staff Conference […]
Black Sea Grain Corridor, Weather and Harvest Pressure Wheat Prices
Russia’s unprovoked invasions of Ukraine sent already bullish wheat futures prices soaring earlier this year. However, the first grain vessel to leave Ukraine since Russia’s February invasion set sail on Monday, August 1. The ship, carrying 27,000 metric tons (MT) of corn bound for Lebanon, was able to sail nine days after Ukraine and Russia […]
What is the Outlook for World Durum Production?
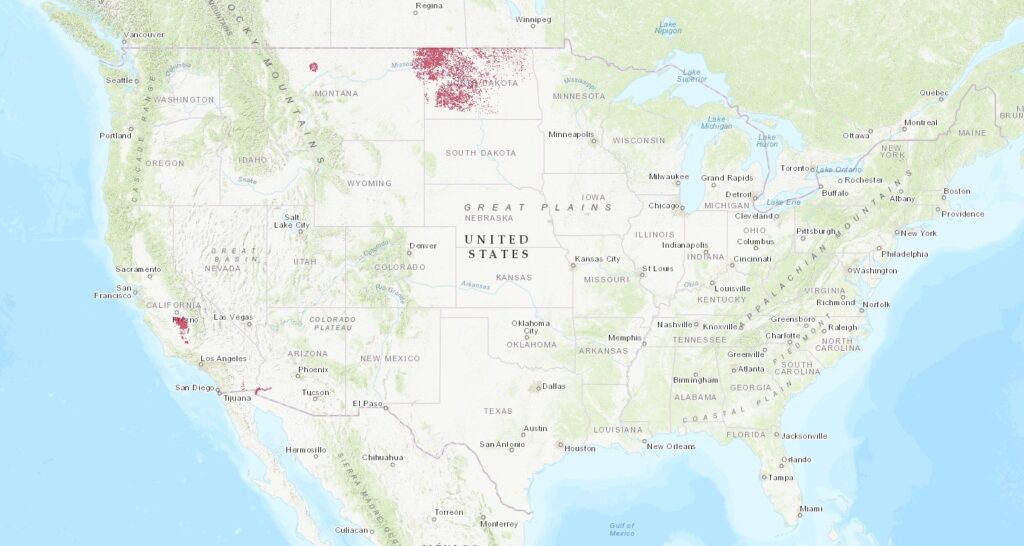
Global durum production is expected to rebound in 2022/23, but stocks are likely to remain tight this season. Total durum production in 2022/23 is expected to increase 10% to 33.9 MMT, led by increases in the United States, Canada, and Mexico. While durum production in North America looks good, production across Europe and North Africa […]
Harvest and Much Improved Conditions Pressure U.S. Soft White Market
Volatility remains the key word when looking at wheat prices, and the soft white (SW) market is no exception. From their rapid increase following the severe drought in 2020/21 and the Russian invasion of Ukraine in March 2022, U.S. wheat futures have declined recently and were down more than 4% on July 5, hitting a […]
Export Bans Contrast with U.S. Wheat’s Commitment to an Open, Transparent Market
Consumers and suppliers both appreciate uniformity, the ability to purchase a reliable product that is available when needed. Customers of U.S. wheat know that dependable people grow and supply reliable wheat, which marks the difference between the U.S. wheat market and some competing suppliers. Freedom to Trade Free trade has been upheld in U.S. commerce […]
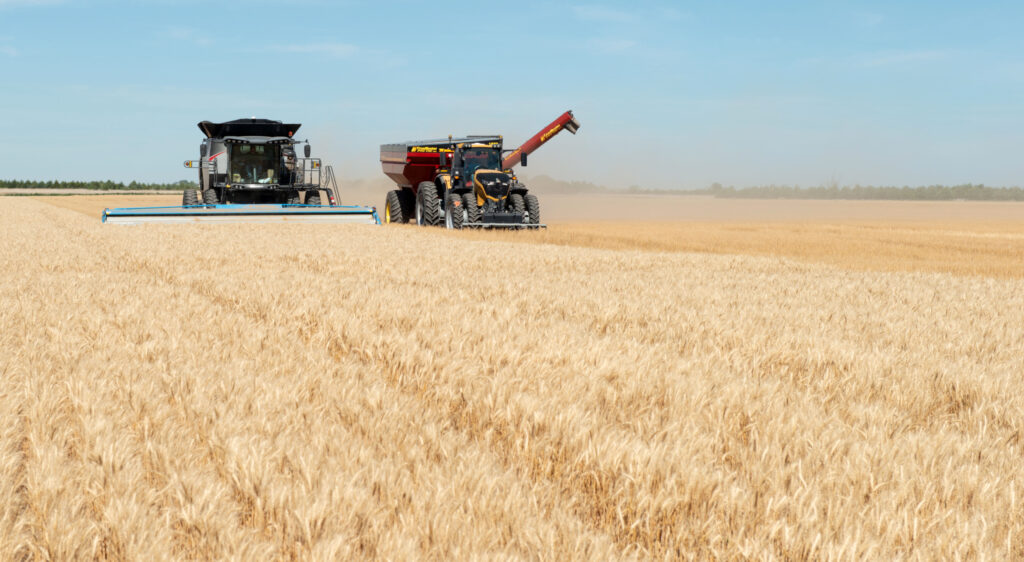
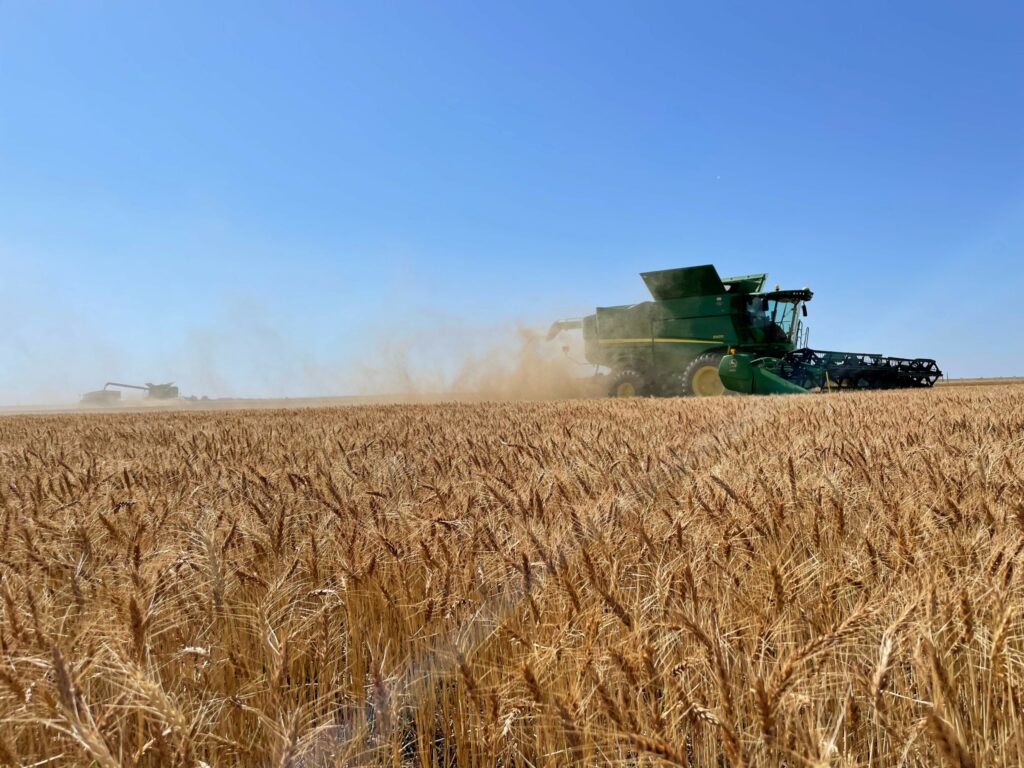
Scenes From A Variable but Smaller Kansas Wheat Crop
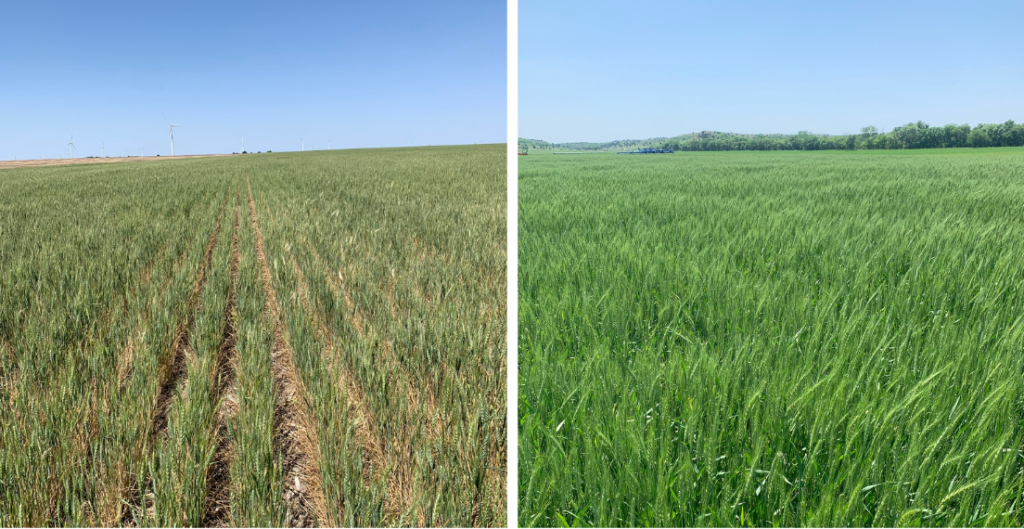
The anxiously awaited Hard Winter Wheat Tour sponsored by the Wheat Quality Council that ended May 19, confirmed that persistent drought will cut the yield potential of the 2022 Kansas wheat crop to its lowest level since 2018. The 83 participants scouting the crop estimated the average yield potential at 39.7 bushels per acre (52.71 […]
War is Just the Latest Factor Behind Higher World Food Prices
Low-income consumers in import-dependent countries will face the greatest hardships as the unprovoked Russian invasion of Ukraine and other factors push world food prices higher. That is one conclusion from a USDA Foreign Agricultural Service (FAS) analysis released in April. U.S. Wheat Associates (USW) is a cooperating partner with FAS export market development programs. Bullish […]
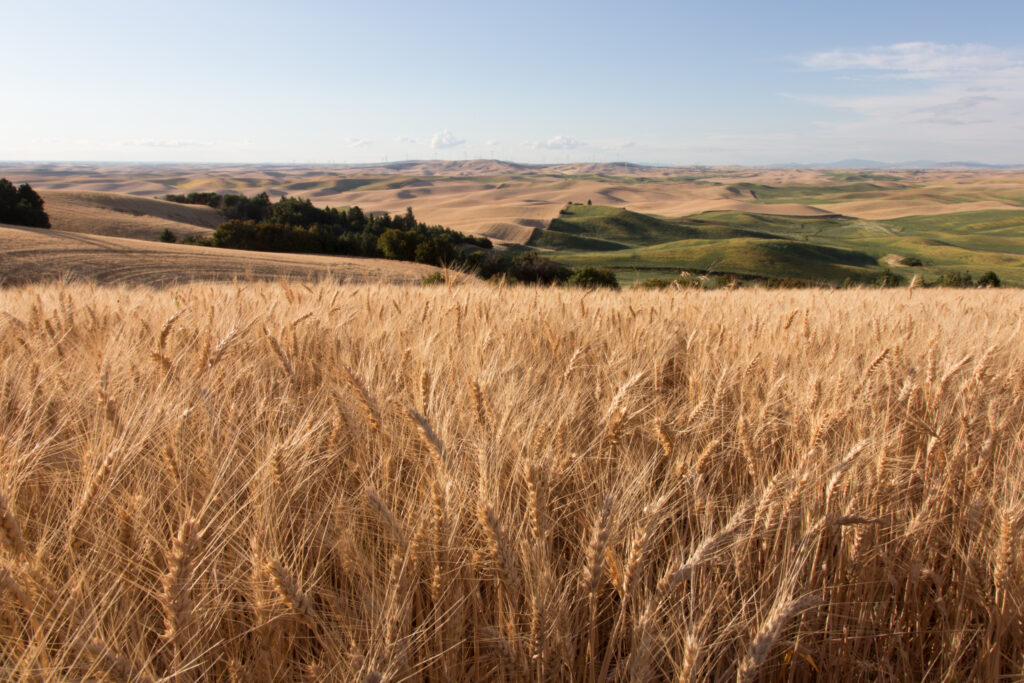
Soft White Wheat Crop Looks Better This Year
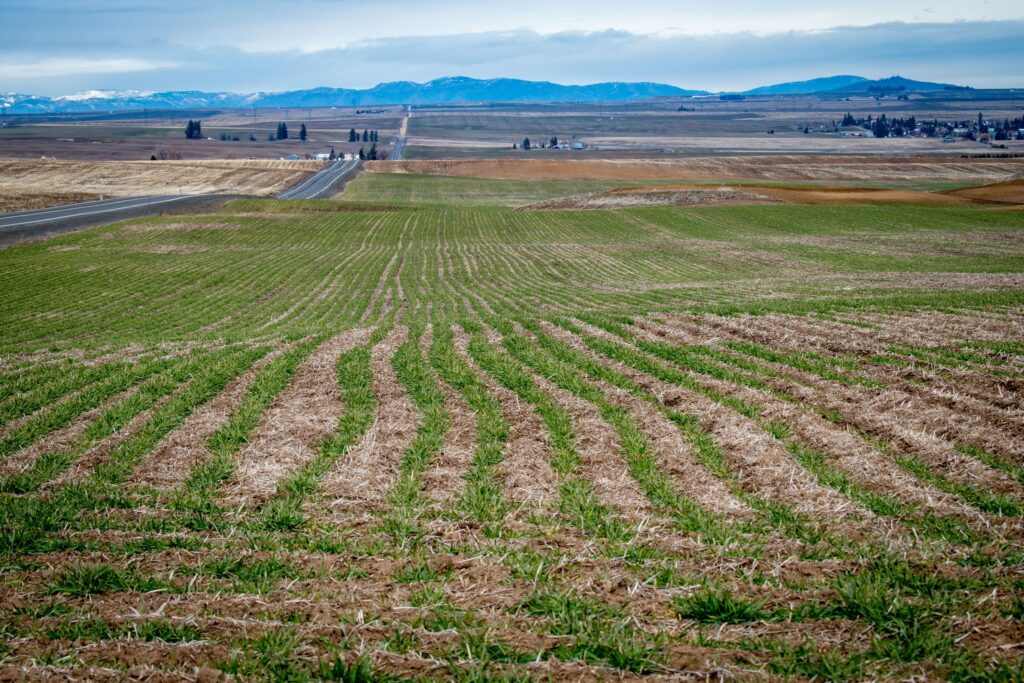
Analysis of the wheat market since February has been underscored by volatility, and no less so for the U.S. soft white (SW) wheat market. The sudden exit of Ukraine from the export market and the uncertainty of Russia’s wheat exports are recent factors in market volatility. Dry weather is another important consideration for winter wheat […]