Initial 2024/25 Estimates Add to Bullish Market Sentiment
Topping off a volatile, weather driven week, the May World Agricultural Supply and Demand Estimates (WASDE), released on May 10, 2024, forecast a tighter global wheat balance sheet and decreased production in several major wheat exporting countries. Moreover, USDA foresees factors that contribute to bullish market sentiment. It expects both world production and consumption to […]
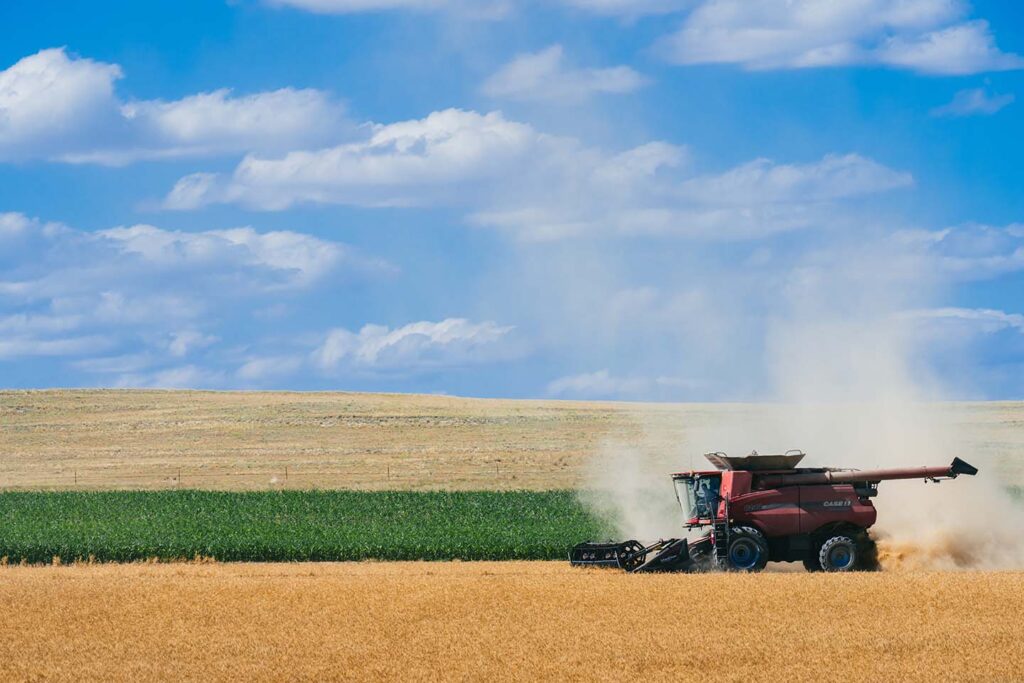
Key Market Mover: Weather Developments Generate Wheat Price Rally
Across the Northern Hemisphere, wheat price and crop development are dominating market discussion. Soon, the first harvests of the 2024/25 crop year will provide more concrete information on supply availability and quality. Until then, weather conditions will play a crucial role in global grain markets as winter wheat enters late growth stages and spring wheat […]
Marketing Year 2023/24 Countdown; First Look at New Crop U.S. Wheat Sales

With just 6 weeks left in marketing year (MY) 2023/24, many buyers are locking in purchases for June and July shipment, shifting much of the export focus to MY 2024/25, or “new crop,” U.S. wheat sales that are gradually ramping up at a faster pace compared to a year ago. The following will outline MY […]
Articles of Interest – The Latest News About the U.S. Wheat Crop

Every weekday, U.S. Wheat Associates (USW) searches U.S. and global media for news about the U.S. wheat crop and the world wheat market. USW shares the news of the day as a service to our domestic stakeholders. The articles of interest on Monday, April 29, summarized below also have value for our overseas customers. Wheat […]
Shifted Trade Flows: Black Sea Durum Enters the Global Market
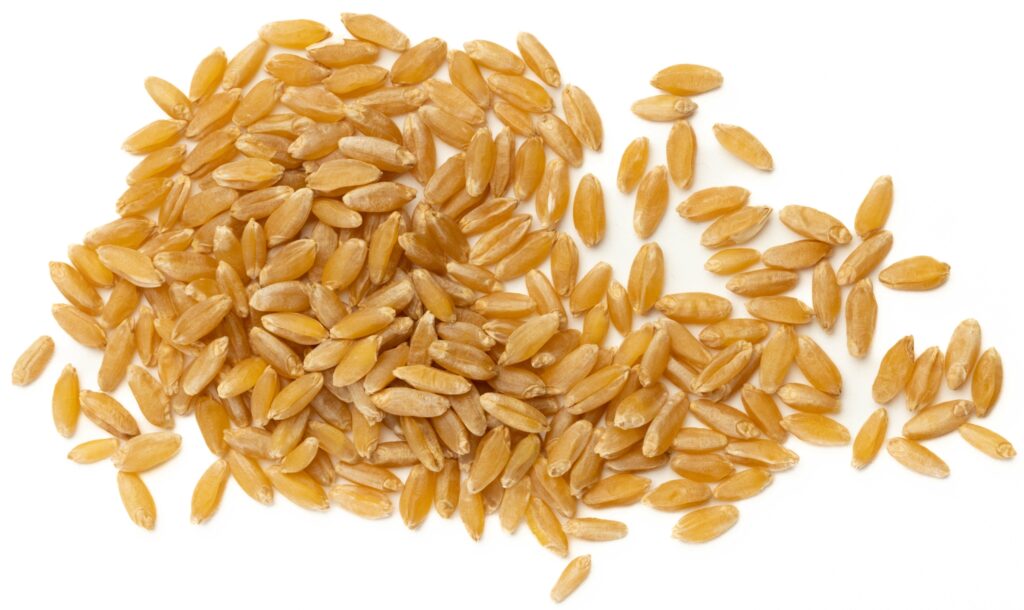
World durum supplies were tight early in marketing year 2023/24 as drought in the Middle East and Canada and quality issues in the European Union (EU) decreased durum availability and put upward pressure on global durum prices. However, as the marketing year continued, non-traditional durum exports from Russia and Türkiye began flooding markets with low-priced […]
A Better Start for U.S. Hard Red Winter Wheat Conditions
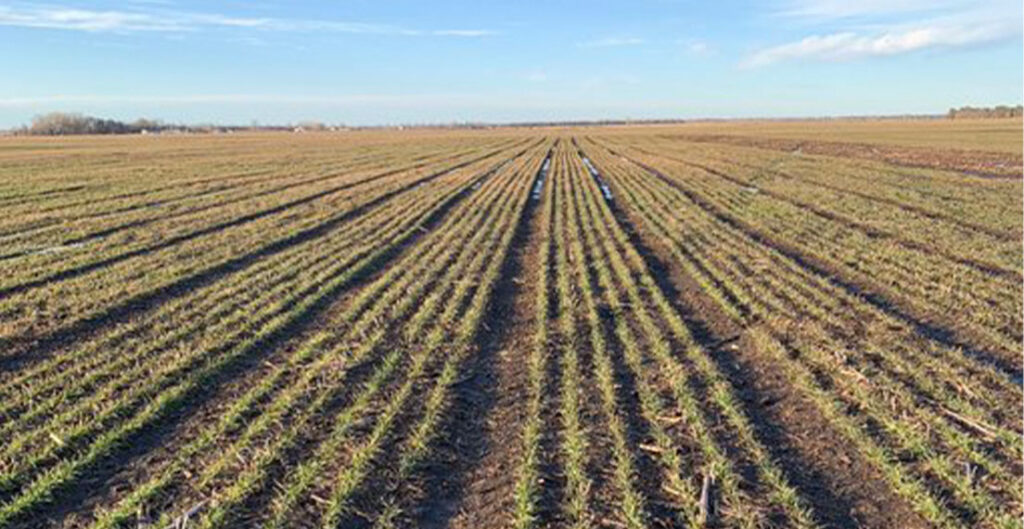
With U.S. hard red winter (HRW) and hard white (HW) wheat moving into its crucial vegetative state, U.S. Wheat Associates (USW) and its state wheat commission member organizations have started weekly conference calls to share wheat condition reports. Overall, wheat in Central and Southern Plains entered 2024 in better condition than compared to the prior […]
New USDA Report Estimates Less Wheat Planting, More Ending Stocks
On March 28, the United States Department of Agriculture (USDA) released its yearly Prospective Plantings and quarterly Grains Stocks reports. The reports provide crucial insights to U.S. wheat importers as we enter the concluding months of the 2023/24 marketing year and look ahead to the 2024 harvest. This article will analyze USDA’s recent reports on […]
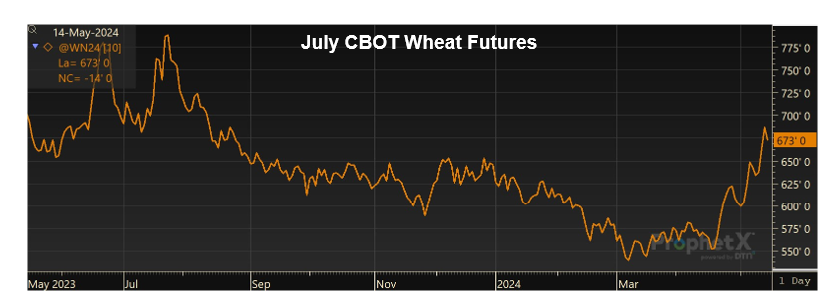
Wheat Price Perspectives: A Look at Long-Term Trends

Over the last year, world wheat prices have trended steadily lower, continuing their fall from the highs hit in May of 2022 after Russia invaded Ukraine. Ample wheat stocks from Russia and record exports flowing from the Black Sea continue to weigh on global wheat prices. The average world FOB price has decreased $32/MT from […]
Setting the Stage for the 2024/25 World Wheat Crop
As March begins, world wheat markets look to new information that may provide a glimpse into what the 2024/25 marketing year brings. As northern hemisphere winter wheat crops break dormancy, weather becomes increasingly important. Meanwhile, southern hemisphere farmers shift their focus to spring crops and the winter wheat planting season. While world crop updates will […]
USDA Outlook Forum Provides First Glimpse into 2024/25 U.S. Wheat Balance Sheet

As the southern hemisphere wheat harvest nears completion and world anticipates the next northern crop, many buyers, mill owners, and end-product manufacturers are considering purchasing decisions that will affect their businesses into the first quarter of marketing year 2024/25. With forward thinking in mind, USDA released its latest Grains and Oilseeds Outlook on Feb. 15, […]