Key Market Movers: Trade, Currency, and Weather Prompt a Rally
It is no surprise that U.S. trade policy has dominated global news, and potential tariffs have introduced uncertainty into international trade. While the direct effects of tariffs on trade are widely understood, the anticipation of such measures has influenced commodity markets. Concurrently, wheat markets experienced upward pressure, driven by a combination of factors including weather-related […]
U.S. Farmers Pinched by High Costs and Low Prices

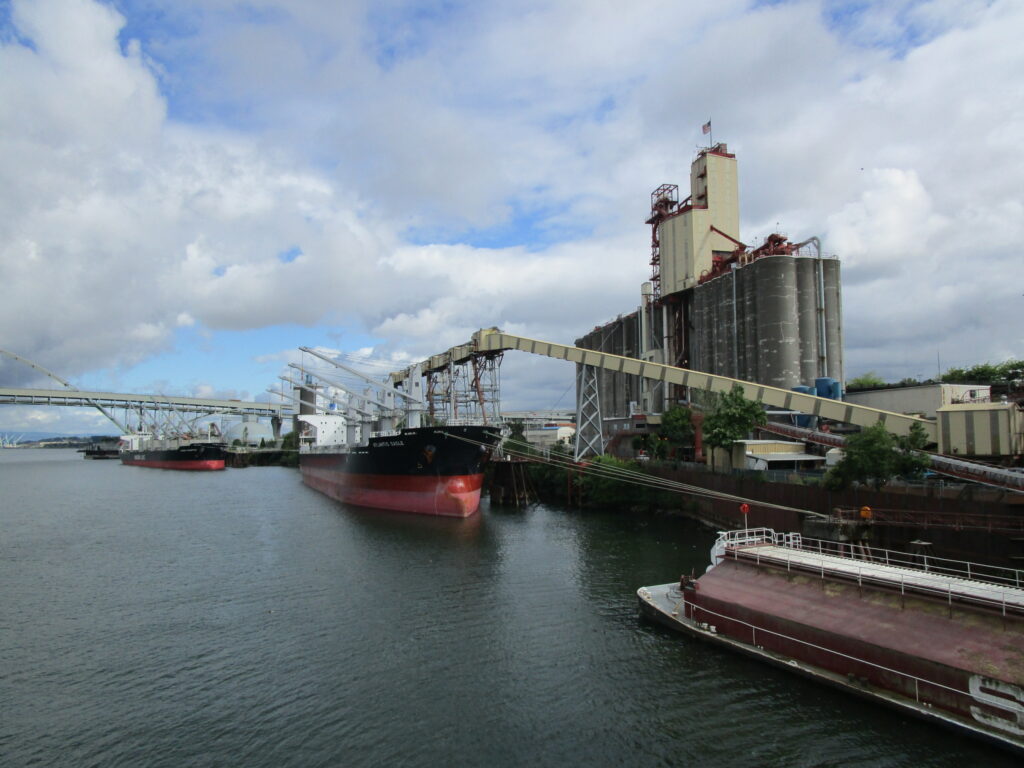
In recent months, wheat markets have stabilized, contrasting the unprecedented volatility following war, drought, and economic uncertainty that has defined markets over the last few years. After dipping to price levels not seen since 2020 earlier this year, world FOB values have recovered slightly, clustering near $250/MT. We have previously looked at long-term trends in […]
Price Perspectives: A Bounce from Four-Year Lows

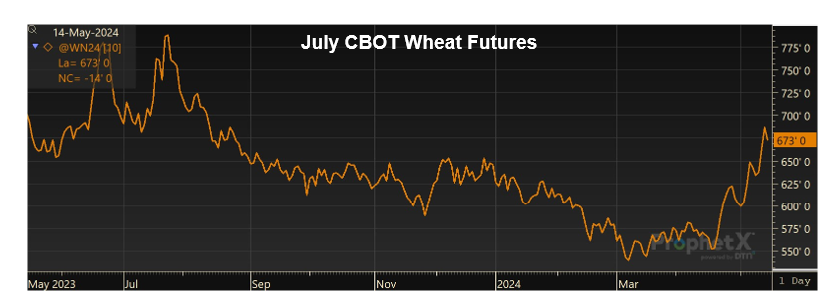
On August 26, 2024, CBOT, KBOT, and MGEX wheat futures prices declined to four-year lows, pressured by the Northern Hemisphere harvest, adequate supplies in aggressive exporters, and generally low prices for feed grains and oilseeds. Since then, futures prices sustained a multi-week rally, fueled by a weakening dollar, technical short covering from speculative funds, and […]
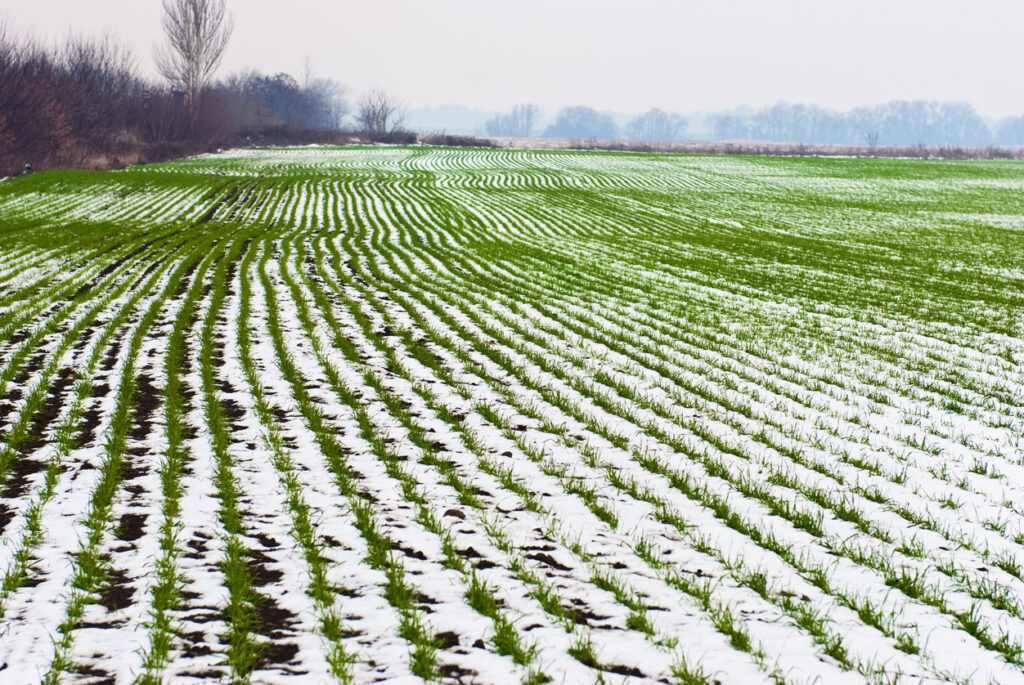
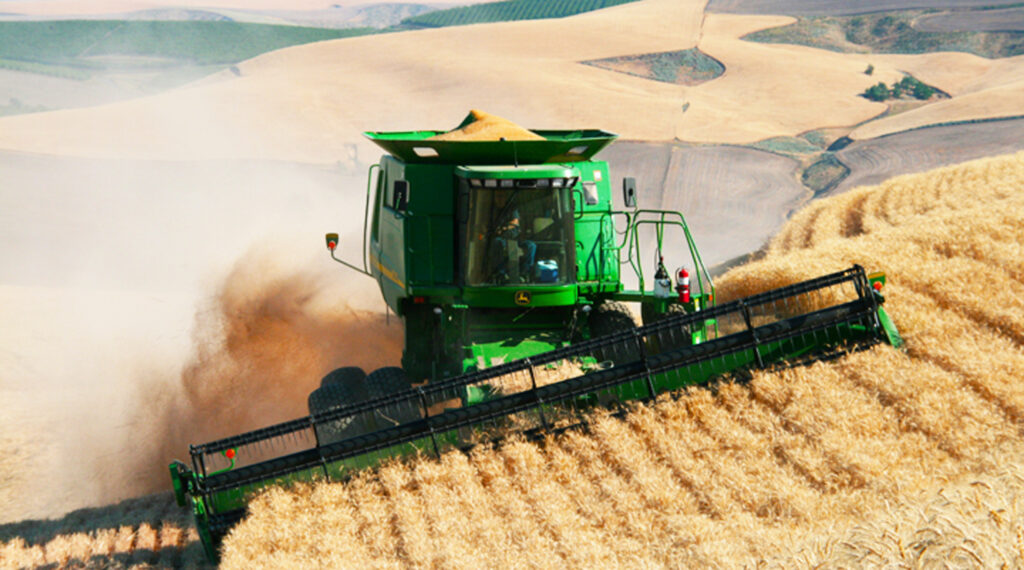
Production Outlook: Turning a Corner in 2024
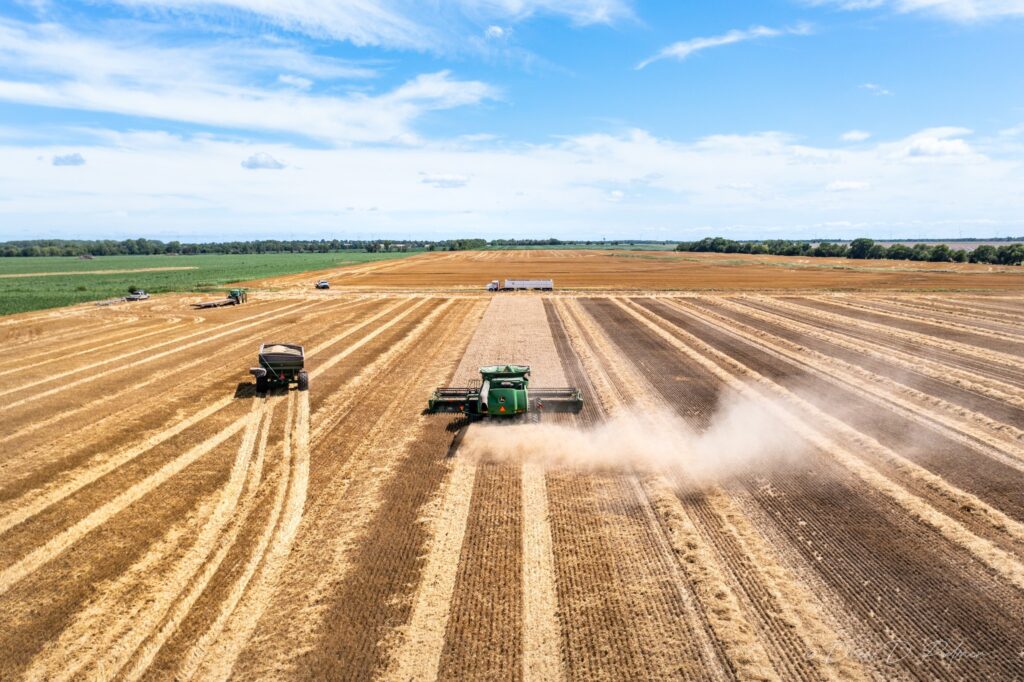
As harvest rolls throughout the U.S. Plains, farmers see the culmination of their year’s hard work and investment as crops move from field to bin, eventually becoming products consumed worldwide. After three years of drought that reduced yields, impacted quality, and drove near-record abandonment, the 2024 harvest season stands out as the most promising in […]
Volatile Wheat Markets Highlight Unexpected Opportunities
In late May, U.S. Wheat Associates (USW) reported on bullish wheat market sentiment, driven by adverse weather and changing supply and demand conditions. Since then, the volatility that has remained a constant in wheat markets for more than two years returned. From May 24 to June 21, CBOT, KCBOT, and MGEX wheat futures dropped 69 […]
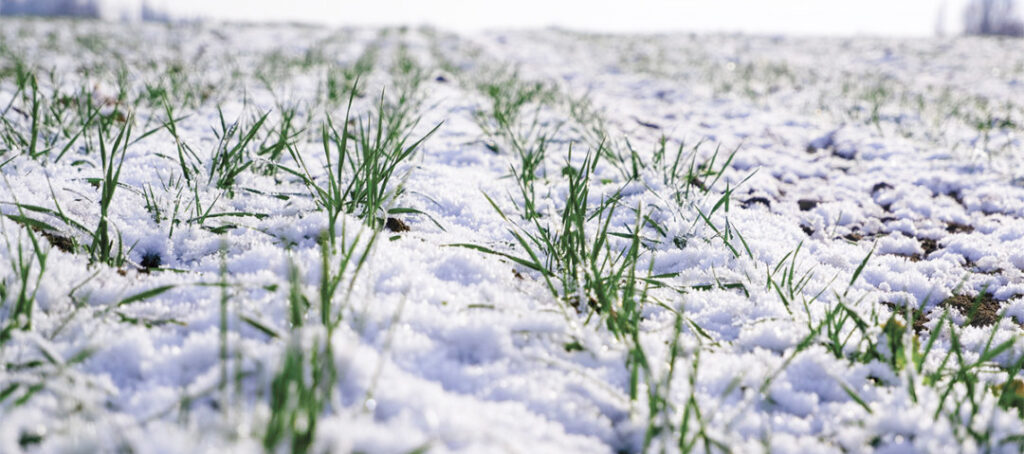
Key Market Mover: Weather Developments Generate Wheat Price Rally
Across the Northern Hemisphere, wheat price and crop development are dominating market discussion. Soon, the first harvests of the 2024/25 crop year will provide more concrete information on supply availability and quality. Until then, weather conditions will play a crucial role in global grain markets as winter wheat enters late growth stages and spring wheat […]
Wheat Price Perspectives: A Look at Long-Term Trends

Over the last year, world wheat prices have trended steadily lower, continuing their fall from the highs hit in May of 2022 after Russia invaded Ukraine. Ample wheat stocks from Russia and record exports flowing from the Black Sea continue to weigh on global wheat prices. The average world FOB price has decreased $32/MT from […]
Inputs and Profits: Current Conditions Prove There’s Nothing Magical About Farming Math
Kitchen table math can be a chore this time of year, as U.S. wheat farmers shovel their crop production costs into calculators, hoping the numbers they scoop out next year will be magically heavier than those they tossed in this year. But here’s a secret about the math of farming: it isn’t really magic. “There’s […]
World Wheat Prices Hover at Lower Levels With Bullish Factors Lurking

Since the start of the year, world wheat prices have consistently trended lower, with Russian wheat maintaining its position as the world’s cheapest origin. With the Northern Hemisphere wheat harvest now complete, it brings about the question: have markets touched their seasonal lows, and in what direction will they go next? In this article, we […]
U.S. Soft White Wheat Production: It’s Dry, But Too Early in Harvest to Determine 2023 Yield
Amid this year’s volatile markets and relatively slow demand, U.S. soft white wheat (SW) has provided many customers with buying opportunities, positioning itself as one of the most competitive classes of U.S. wheat. In recent months, dryness in the Pacific Northwest (PNW) this spring dominated market news and discussions about quality. As harvest ramps up […]