Uncertainty, Weather Intensify Market Volatility

Spring’s arrival in the Northern Hemisphere typically brings a period of weather-related market volatility, a pattern that has held true this crop year. However, ongoing uncertainty from dynamic policy changes is shaking the usual seasonal in the U.S. wheat trade outlook. Weather Market Whiplash In February, concerns over cold and dry conditions in the Black […]
Key Market Movers: Trade, Currency, and Weather Prompt a Rally
It is no surprise that U.S. trade policy has dominated global news, and potential tariffs have introduced uncertainty into international trade. While the direct effects of tariffs on trade are widely understood, the anticipation of such measures has influenced commodity markets. Concurrently, wheat markets experienced upward pressure, driven by a combination of factors including weather-related […]
Security, Reliability, and Accuracy: A Look into USDA NASS Reporting

Every year the National Agricultural Statistics Service (NASS), Foreign Agricultural Service and other USDA agencies publish hundreds of reports to meet information needs for dozens of agricultural products. For wheat, USDA NASS releases a variety of reports, including: Crop Production* Winter Wheat and Canola Seedings Report Prospective Plantings* World Agricultural Supply and Demand Estimates Crop […]
Wheat Industry News From Around the World
Speaking of Wheat “As president … I talked to experienced producers facing the realities of this downturn in the ag economy, and they feared they would not be able to secure operating credit in 2025 without some form of economic assistance. This legislation provides farmers with a bridge heading into next year. However … enacting […]
U.S. Farmers Pinched by High Costs and Low Prices

In recent months, wheat markets have stabilized, contrasting the unprecedented volatility following war, drought, and economic uncertainty that has defined markets over the last few years. After dipping to price levels not seen since 2020 earlier this year, world FOB values have recovered slightly, clustering near $250/MT. We have previously looked at long-term trends in […]
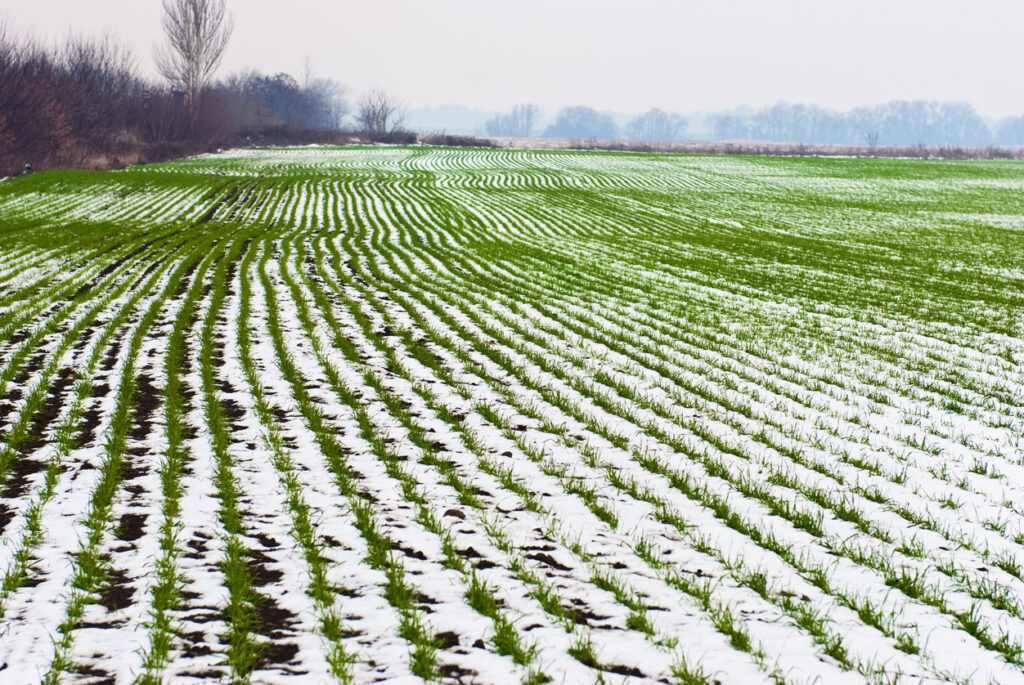
November Precipitation Rapidly Improves U.S. Winter Wheat Condition

Wheat farm families across the United States are sharpening their pencils to figure out how to deal with the on-going challenges of high input costs and low crop prices. Fortunately, 2025 winter wheat crop conditions do not create another concern for many of them following a remarkable turnaround in November. Writing in Progressive Farmer Dec. […]
Key Market Mover: Concern About Dry Conditions Continues to Drive Markets
As the Northern Hemisphere harvest concludes and crops in the Southern Hemisphere near maturation, wheat markets are still highly sensitive to weather-related news. As headlines about dry conditions around the globe come and go, and markets fluctuate daily, having information about the current drought conditions worldwide and potential impacts remains important to wheat buyers. Southern […]
Price Perspectives: A Bounce from Four-Year Lows

On August 26, 2024, CBOT, KBOT, and MGEX wheat futures prices declined to four-year lows, pressured by the Northern Hemisphere harvest, adequate supplies in aggressive exporters, and generally low prices for feed grains and oilseeds. Since then, futures prices sustained a multi-week rally, fueled by a weakening dollar, technical short covering from speculative funds, and […]
USW Market and Crop Information Reports Provide Valuable, Timely Information

U.S. Wheat Associates (USW) is committed to helping customers get the wheat they want at the best value possible by providing critical market and crop information throughout the year. USW works closely with a network of traders, extension specialists, market contacts, USDA staff and, of course, our colleagues in overseas offices to analyze and update […]
Volatile Wheat Markets Highlight Unexpected Opportunities

In late May, U.S. Wheat Associates (USW) reported on bullish wheat market sentiment, driven by adverse weather and changing supply and demand conditions. Since then, the volatility that has remained a constant in wheat markets for more than two years returned. From May 24 to June 21, CBOT, KCBOT, and MGEX wheat futures dropped 69 […]