War Disruptions and Logistics Incentivize Imported European Wheat
The news that U.S. flour milling companies have imported European wheat has raised concerns and frustrations for U.S. wheat stakeholders. To an organization like U.S. Wheat Associates (USW) that with our state wheat commission members promotes exports on behalf of U.S. wheat farmers, such news is particularly disappointing. After all, U.S. farmers produce enough wheat […]
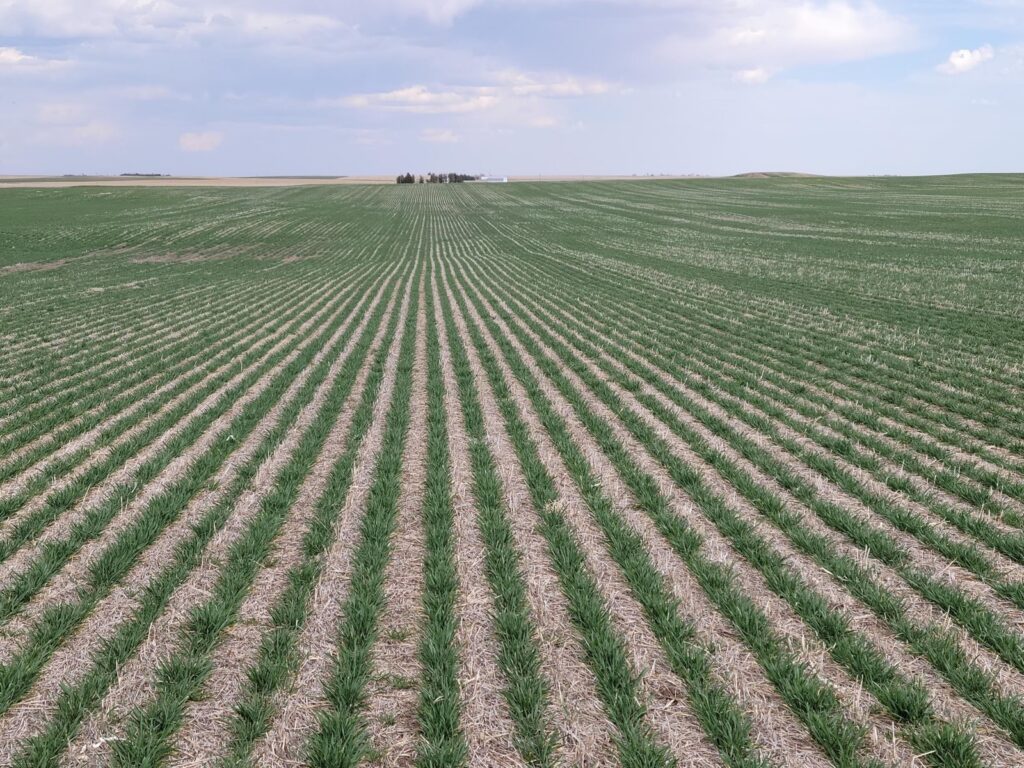
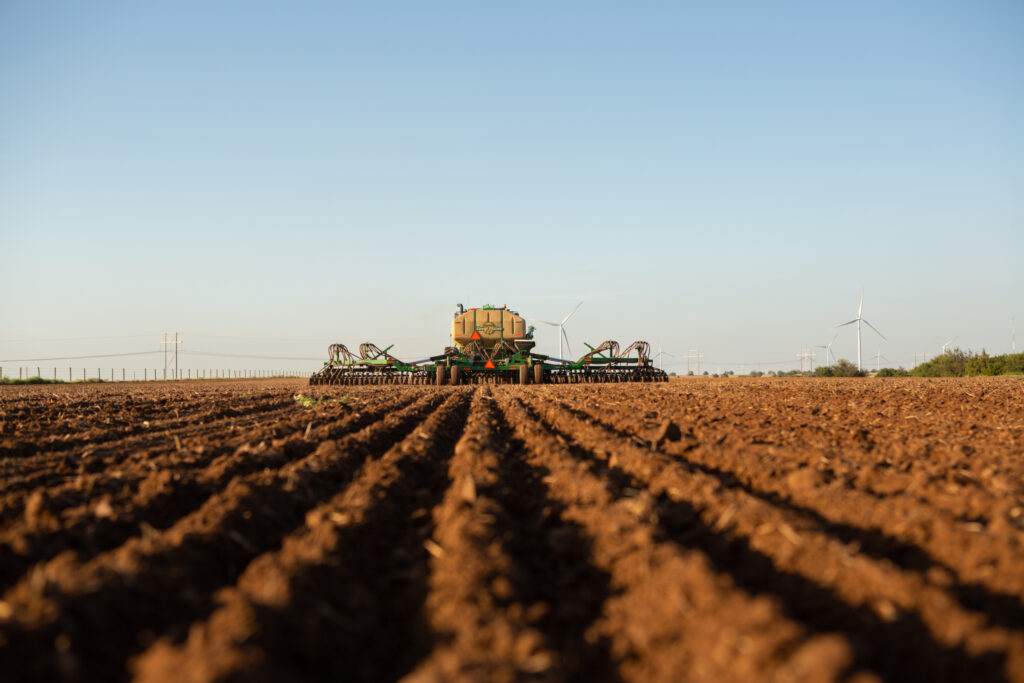
Optimism Emerges for U.S. Hard Red Spring Wheat
As the 2023/24 marketing year begins, the market awaits the outlook for the new crop harvest. Despite early concerns anticipating wet conditions and late planting similar to the 2022 crop year, hard red spring (HRS) planting progress has surpassed expectations. Rapid Planting Progress Spring wheat farmers have made incredible planting progress after a historically snowy […]
USDA Reports Provides First Look Into 2023/24 Crop Year
On May 12, USDA released its initial estimates for the 2023/24 marketing year (MY) year, providing the first glimpse into how the world wheat situation has shifted in response to political instability, inflation, climate variability, and the volatility seen in the last year. This article will examine key takeaways from the World Agricultural Supply and […]
2023 Wheat Tour Sees Short Crop; Black Sea Grain Deal Prevents Rally
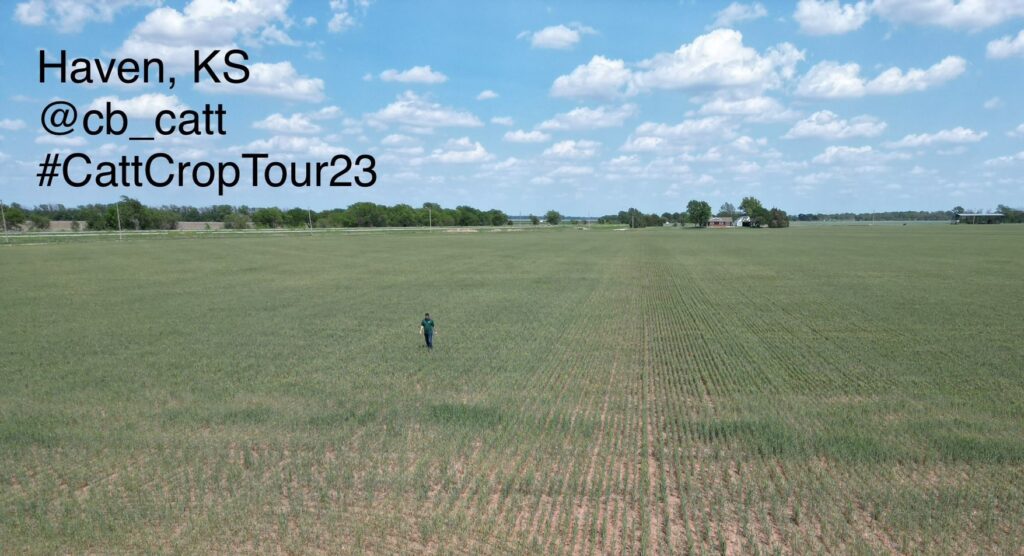
As expected, the results of the 2023 Hard Winter Wheat Tour the week of May 15 confirmed the extremely short wheat crop in Kansas and surrounding states. Typically, the market reaction would be bullish. But 2023 is not a typical year, and the volatile uncertainty of the Black Sea conflict once again overshadowed basic supply […]
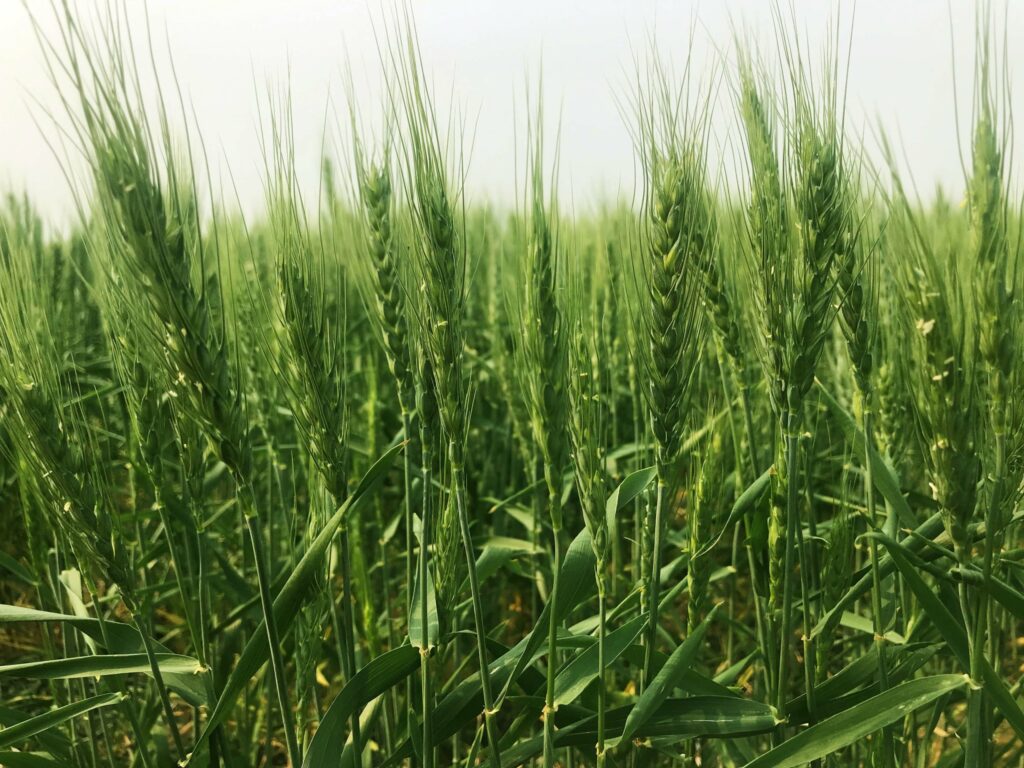
Competitive U.S. Soft Wheat Creates Buying Opportunity

Just one year ago, U.S. wheat prices hovered near record highs. The geopolitical ramifications of Russia’s invasion of Ukraine stoked supply concerns and fears of spiraling food price inflation, and India had just banned wheat exports, further fueling wheat supply fears. Flash forward to the week of May 2, 2023, Chicago Board of Trade soft […]
CPKS Railroad Merger and U.S. Wheat Exports

On April 18, 2023, Kansas City Southern Railway Company (KCS) and Canadian Pacific Railway Limited (CP) officially merged to create a new Class 1 railroad CPKS, the first single-line service across Canada, the U.S., and Mexico (map above from Trains.com). Rail logistics comprise a sizeable portion of U.S. wheat export basis, encompassing the costs of […]
Wheat Industry News
News and Information from Around the Wheat Industry Speaking of Wheat “Until some of these geopolitical conflicts are resolved — it’s difficult to envision a return to the level of free trade we enjoyed through the late 20th and early 21st centuries. Difficult as it may be, governments must resist the urge to limit […]
USDA Reports Confirm the Tight U.S. Wheat Balance Sheet

On March 31, the United States Department of Agriculture (USDA) released its yearly Prospective Plantings Report, and Quarterly Grains Stocks reports. The reports provide valuable insights for U.S. wheat importing customers as we enter the final two months of the 2022/23 marketing year and look ahead to the 2023 harvest. In this article, we will […]
Wheat Industry News
News and Information from Around the Wheat Industry Speaking of Wheat “In my view, [news that Cargill and Viterra will stop loading Russian grain] puts more questions around Russia’s ability to export. Russian state exporters claim that they’ll be able to keep grain moving out at the same pace, but major speculative funds holding […]
Perspectives on March 31 Prospective Plantings and Stocks Reports
Each year, on March 31, those who grow, trade or import U.S. agricultural commodities look to USDA’s annual Prospective Plantings and Quarterly Grain Stocks Report for indications of potential price movements. The consensus from analysts across the industry on how this week’s reports will affect wheat markets is generally bullish. For reference, in its January […]