From specialty products such as sponge cakes or Asian noodles to blending with HRS for improving bread color, U.S. soft white (SW) wheat flour has the versatility to improve the quality of a wide variety of products. It has a low protein of 8.5% to 10.5% (12% mb), low moisture and weak gluten. SW includes winter and spring varieties increasing the protein range and functionality within the class.
For the miller, SW delivers excellent results. Arriving at the mill with an average moisture of less than 10%, an average test weight of more than 80 hectoliter mass and a low quantity of screenings, SW wheat provides the millers every opportunity for high flour extraction. The lower wheat moisture allows the miller to temper the wheat to a lower average target moisture optimizing flour extraction, particle size and color.
For the baker, low moisture content creates an advantage by optimizing water absorption and product quality to the consumer. The finer particle size may increase the rate of water absorption, decreasing mix time and improving production efficiencies. With the fine particle size and starch characteristics, SW flour creates a unique and tender texture for many end-products.
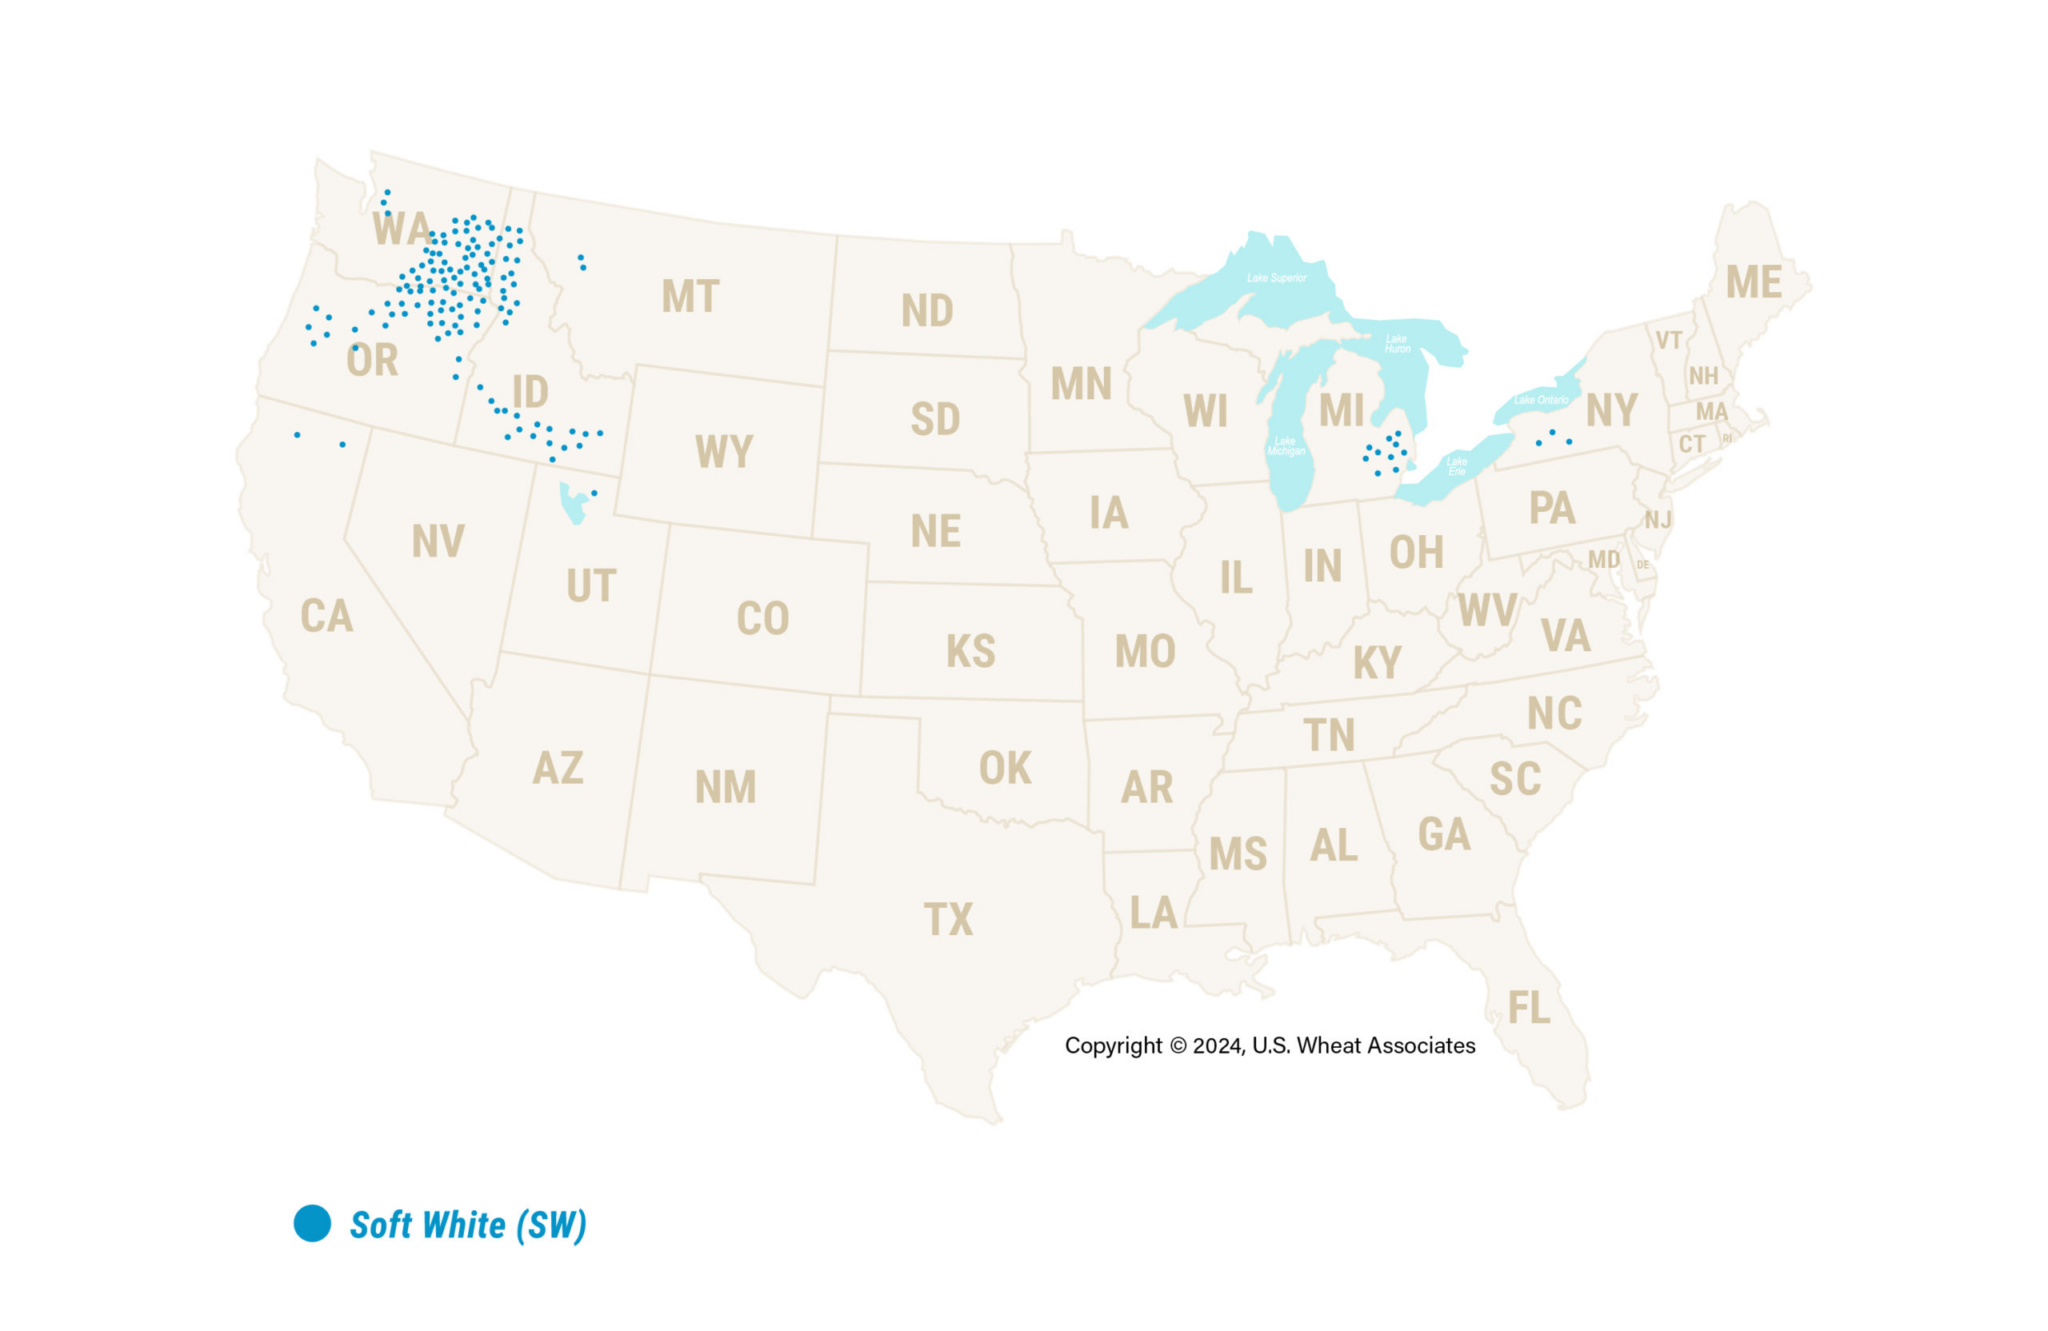
Where is U.S. Soft White grown?
U.S. soft white (SW) is grown primarily in the Pacific Northwest (PNW) with approximately 80% exported and shipped via Pacific ports.
Soft White (SW)
Download Reports
Please select your preferred language and year and then click Download
2023 U.S. Soft White Production
According to USDA’s Small Grains Annual Summary released September 29, 2023, production of the 2023 U.S. SW crop is estimated to be 5.8 million metric tons (MMT), a 17% decrease from last year’s 6.9 MMT and below the 5-year average of 6.3 MMT.
2023 (MMT)
2022 (MMT)
5-Year Average (MMT)
Total SW production in states sampled
5.3
6.6
5.9
Soft White subtotal
5.1
6.3
5.7
White Club subtotal
0.2
0.3
0.2
Total U.S. SW Production
5.8
6.9
6.3
*States sampled: Idaho, Oregon and Washington. Numbers may not match exactly due to rounding.
2023 U.S. Soft White Crop Quality Data Highlights
The Pacific Northwest (PNW) experienced drier growing conditions and moderate temperatures, contributing to a 2023 wheat crop with above average protein. The crop has appropriately weak to medium gluten strength and acceptable to good finished product characteristics. SW is especially suited for use in cakes, pastries, cookies and snack foods. The high protein segment of the SW crop provides opportunities in blends for crackers, Asian noodles, steamed breads, flat breads and pan breads. Club, with very weak gluten strength, is typically used in a Western White blend with SW for cakes and delicate pastries.
U.S. SOFT WHITE AND WHITE CLUB AVERAGE COMPOSITE DATA HIGHIGHTS
The table below provides highlights of Soft White and White Club crop averages. For full quality results, please see the 2023 U.S. Wheat Associates Crop Quality Report.
2023 (MMT)
2022 (MMT)
5-Year Average (MMT)
SW
Club
SW
Club
SW
Club
Test Weight (lb/bu)
60.3
60.7
61.0
60.6
61.1
60.6
Test Weight (kg/hl)
79.3
79.8
80.2
79.8
80.3
79.7
Moisture (%)
9.1
8.6
8.9
7.8
9.1
8.4
Wheat Protein (%) 12% mb
11.1
10.6
9.5
10.1
10.0
10.0
Wheat Protein (%) 0% mb
12.6
12.0
10.8
11.5
11.2
11.3
Wheat Falling Number (sec)
336
327
340
356
328
339
U.S. Soft White Subclasses
Under the Official United States Standards for Grain, Soft White wheat is divided into the following three subclasses:
Soft White (SW) – contains not more than 10% of white club wheat.
White Club (WC) – contains not more than 10% of other soft white wheats.
Western White (WW) – contains more than 10% of white club wheat.
Some customers specify varying levels of the soft white wheat and white club wheat blend to take advantage of club wheat’s weaker gluten characteristics for sponge cake and other confections.
U.S. Soft White Sample Collection and Analysis
Official grade, protein, moisture, 1000 kernel weight and falling number tests were determined on each sample. The remaining tests were conducted on three composite samples categorized by protein ranges of <9.0%, 9.0 to 10.5%, >10.5% and one composite of all White Club (Club) samples.
Samples were collected in three states by the Wheat Marketing Center, state wheat commissions and private and grain grading organizations.
Milling and wheat and flour quality testing and analysis were conducted by the Wheat Marketing Center.
Official grades were determined by the USDA Federal Grain Inspection Service (FGIS).
View Other Classes
Apr 30, 2024
Contact Us
With just 6 weeks left in marketing year (MY) 2023/24, many buyers are locking in purchases for June and July shipment, shifting much of the…
Read More
Apr 30, 2024
Office Locations Beijing
With just 6 weeks left in marketing year (MY) 2023/24, many buyers are locking in purchases for June and July shipment, shifting much of the…
Read More
Apr 30, 2024
Office Locations Cape Town
With just 6 weeks left in marketing year (MY) 2023/24, many buyers are locking in purchases for June and July shipment, shifting much of the…
Lorem ipsum dolor sit amet, consectetur adipiscing elit, sed do eiusmod tempor
incididunt ut labore et dolore magna aliqua. Ut enim ad minim veniam, quis nostrud
exercitation ullamco.