The aristocrat of wheat when it comes to “designer” wheat foods like bagels, artisan hearth breads, pizza crust and other strong dough applications, U.S. hard red spring (HRS) wheat is also a valued improver in flour blends. It has high protein of 12.0% to 15.0% (12% mb), hard endosperm, red bran, strong gluten and high water absorption.
For the miller, the reward for incorporating HRS into the grist includes a higher-than-average flour yield from its harder, more compact endosperm. This creates excellent granulation through the break system, providing an abundance of stock to the purifiers producing the maximum amount of low ash, bright color flour.
For the baker, HRS delivers strong dough characteristics used alone or as part of a blend to improve the overall performance of the desired dough. In markets where consumers are demanding a “clean label,” HRS flour blended with HRW or other wheat flour can create better water absorption and loaf volume while reducing or eliminating the use of chemical improvers. And many pasta makers around the world know that when traditional durum wheat semolina is not needed, HRS wheat flour or semolina is a very acceptable alternative.
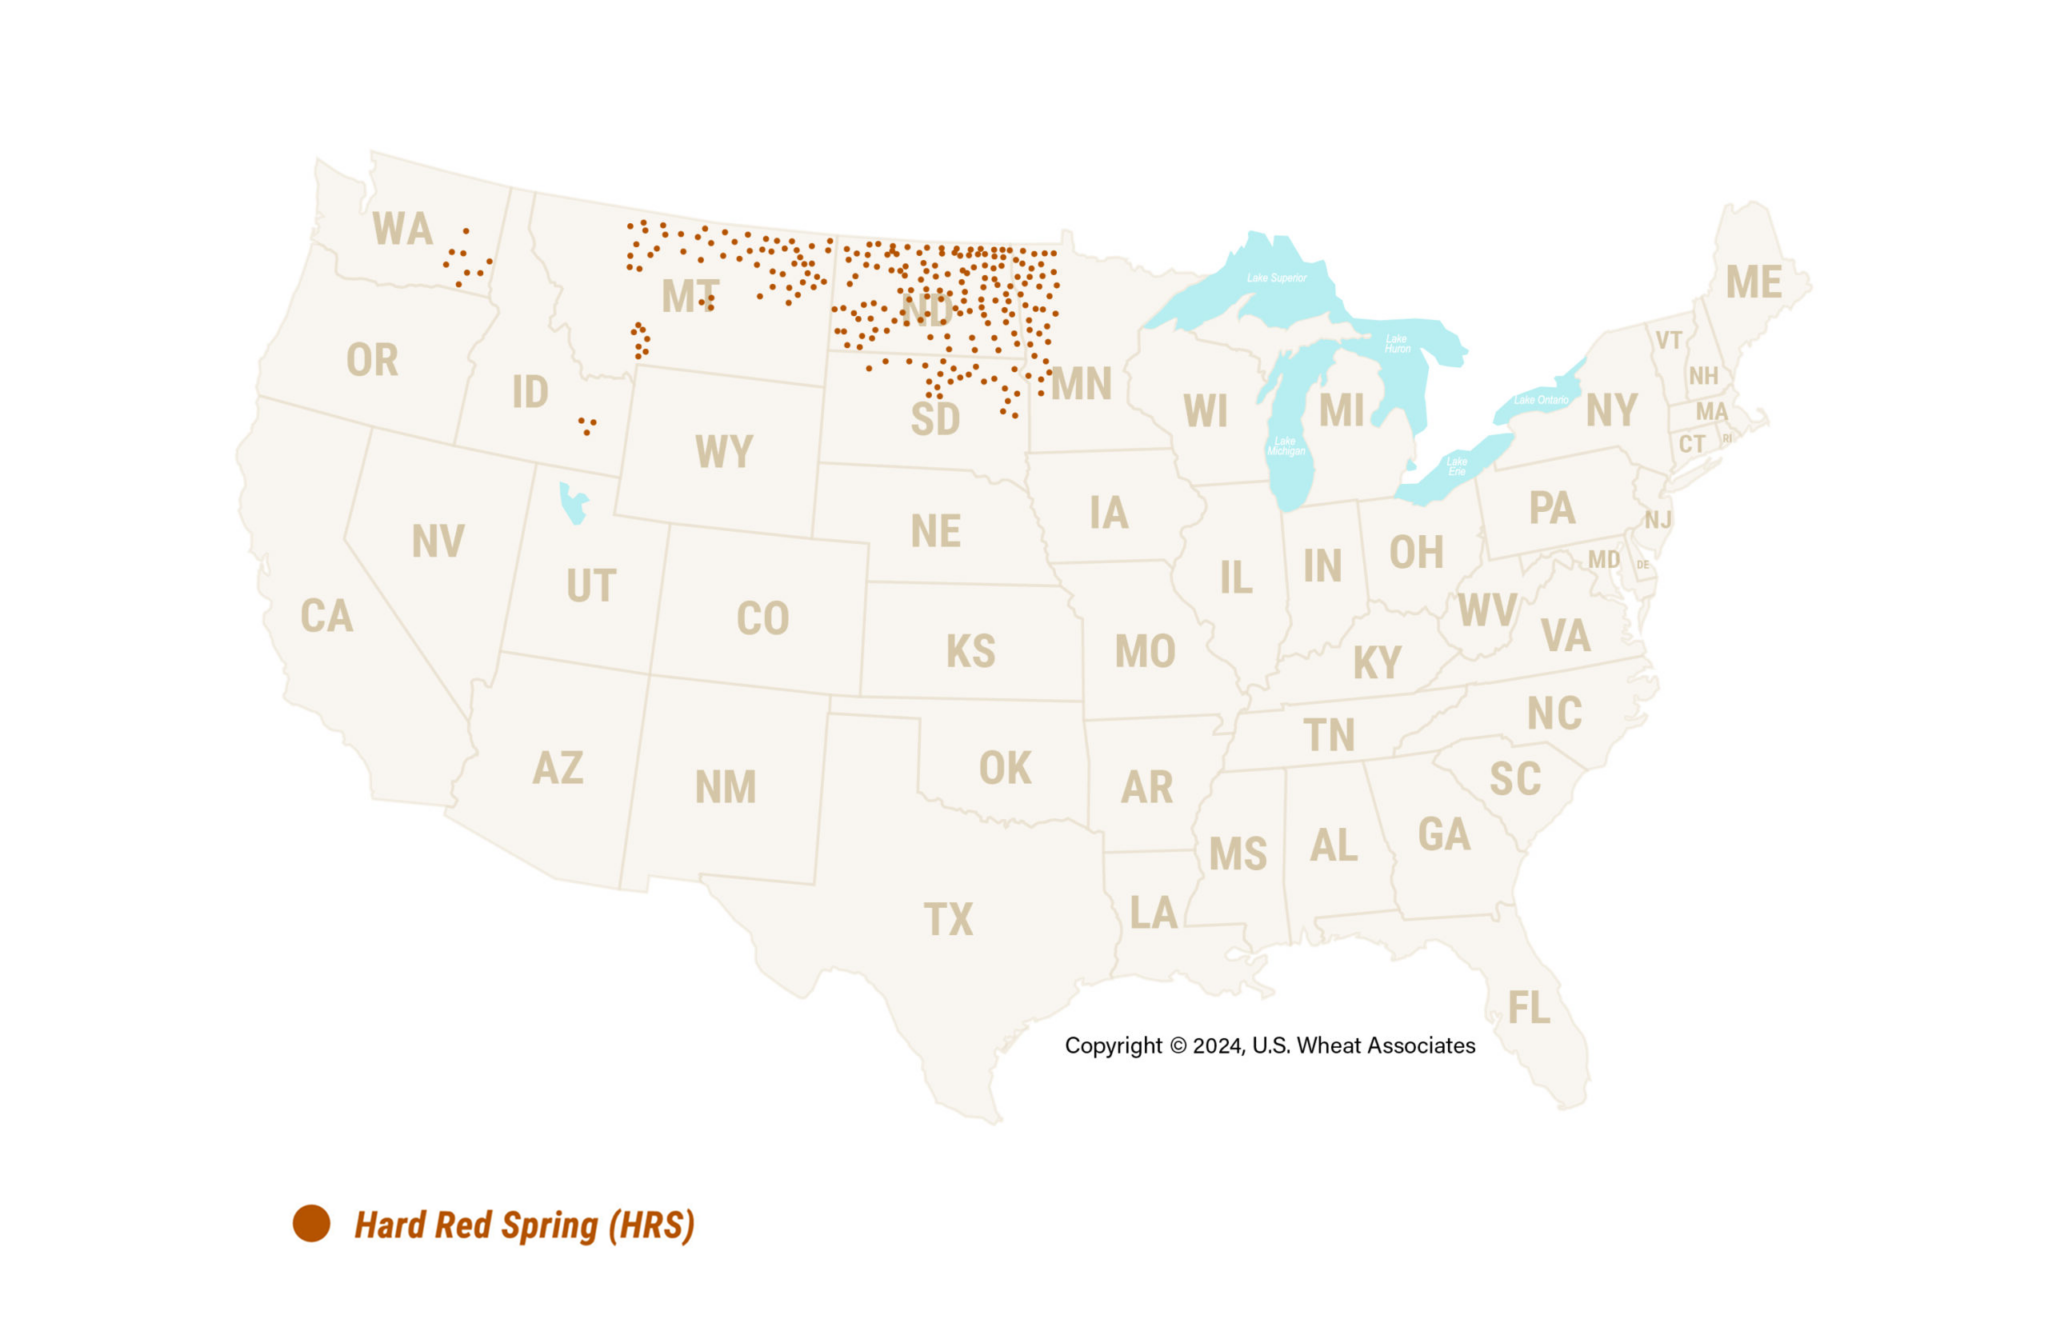
Where is U.S. Hard Red Spring grown?
Grown primarily in the North Central region, U.S. hard red spring (HRS) is the second-largest class of U.S. wheat. HRS can be exported from the Pacific, Gulf, and Great Lakes ports.
Hard Red Spring (HRS)
Download Reports
Please select your preferred language and year and then click Download
2023 U.S. Hard Red Spring Production
According to USDA’s Small Grains Annual Summary released September 29, 2023, production of the 2023 U.S. HRS crop is estimated to be 12.7 million metric tons (MMT), a 5% increase from last year’s 12.1 MMT and above the 5-year average of 12.5 MMT.
2023 (MMT)
2022 (MMT)
5-Year Average (MMT)
Total HRS production in states sampled*
12.7
12.1
12.5
PNW-exportable subtotal
6.4
5.9
6.4
Gulf/Great Lakes-exportable subtotal
6.3
6.3
6.1
Total U.S. HRS Production
12.7
12.1
12.5
*States sampled: Idaho, Minnesota, Montana, North Dakota, South Dakota and Washington. Numbers may not match exactly due to rounding.
2023 U.S. Hard Red Spring Crop Quality Data Highlights
The 2023 U.S. HRS crop has many positive attributes, including higher production, good protein levels, little to no DON, strong dough properties and improved bake parameters. Vitreous kernel (HVAC) content is notably lower than 2022 levels, which may be a challenge for some. Buyers can buy with confidence, but diligent contract specifications are still the best way to get the quality demanded.
U.S. HARD RED SPRING AVERAGE COMPOSITE DATA HIGHIGHTS
The table below provides highlights of total crop “Composite” averages. For full quality results, please see the 2023 U.S. Wheat Associates Crop Quality Report.
2023 Average
2022 Average
5-Year Average
Test Weight (lb/bu)
61.2
62.1
61.6
Test Weight (kg/hl)
80.5
81.6
81.0
Vitreous Kernels (%)
52
74
73
Moisture (%)
12.2
11.6
11.9
Wheat Protein (%) 12% mb
14.2
14.3
14.6
Wheat Protein (%) 0% mb
16.2
16.2
16.6
Wheat Falling Number (sec)
379
386
376
DON (ppm)
<0.5
<0.5
<0.5
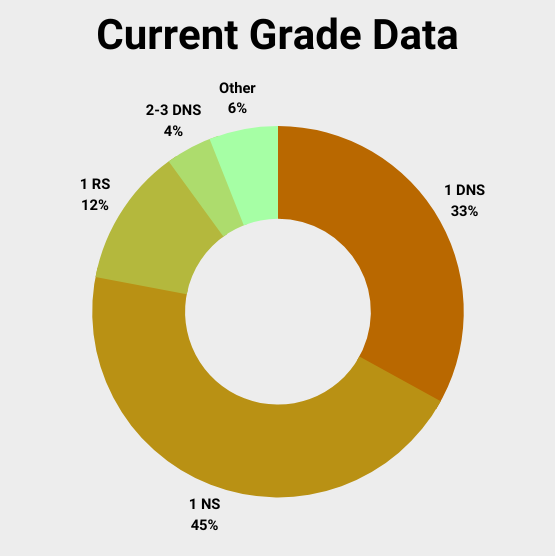
U.S. Hard Red Spring Subclasses
Under the Official United States Standards for Grain, U.S. hard red spring wheat is divided into the following three subclasses based on vitreous kernel content:
Dark Northern Spring (DNS) – at least 75% or more dark, hard, vitreous kernels
Northern Spring (NS) – between 25-74% dark, hard, vitreous kernels
Red Spring (RS) – less than 25% dark, hard, vitreous kernels
U.S. Hard Red Spring Sample Collection and Analysis
Official grade and non-grade factors were determined on 60% of samples. Functionality tests were conducted on 6 composite samples categorized by export region and protein ranges of <13.5%, 13.5 to 14.5% and >14.5%. Production-weighted results are presented as Composite, Eastern and Western Regional averages based on composite samples.
Samples were collected in 7 states at harvest by USDA National Agricultural Statistics Service (NASS), Wheat Marketing Center and state wheat commissions.
Official grades were determined by Northern Plains Grain Inspection.
Milling and wheat and flour quality testing and analysis were conducted by the North Dakota State University HRS Wheat Quality Lab Department of Plant Sciences.
View Other Classes
Apr 30, 2024
Contact Us
With just 6 weeks left in marketing year (MY) 2023/24, many buyers are locking in purchases for June and July shipment, shifting much of the…
Read More
Apr 30, 2024
Office Locations Beijing
With just 6 weeks left in marketing year (MY) 2023/24, many buyers are locking in purchases for June and July shipment, shifting much of the…
Read More
Apr 30, 2024
Office Locations Cape Town
With just 6 weeks left in marketing year (MY) 2023/24, many buyers are locking in purchases for June and July shipment, shifting much of the…
Lorem ipsum dolor sit amet, consectetur adipiscing elit, sed do eiusmod tempor
incididunt ut labore et dolore magna aliqua. Ut enim ad minim veniam, quis nostrud
exercitation ullamco.