Originally printed November 6, 2018 by Kansas Wheat; Reprinted with permission
The phrase heard around the agriculture world is “tell your story.” Today most Americans are three generations removed from the farm so tales from the tractor are more important now than ever. Wheat farmers saw this need, and their conduit of conversation, EatWheat.org, is celebrating its first year of operation.
EatWheat allows the wheat industry to speak with one voice in an effort to reclaim the national conversation on wheat and share one primary message amongst numerous influencers while we dismantle the false promises of wheatless diets.
When urban consumers look down at their plate, many don’t know how that food came from the farm to their table. While it may not be a topic of constant thought, many have begun to wonder about the farmers who produce the food they consume and the processes used to create such a bounty.
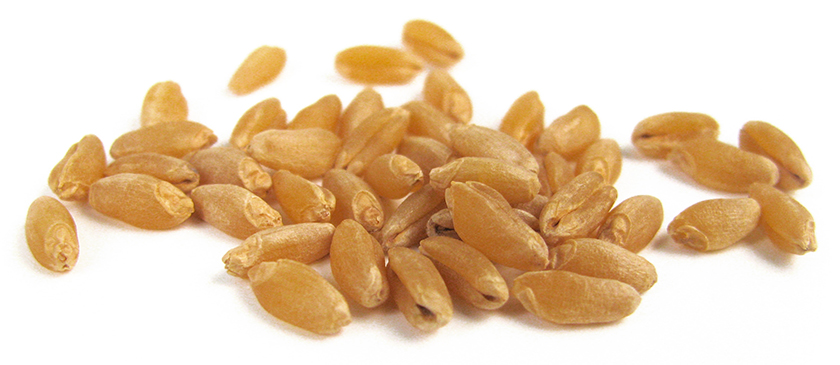
Kansas wheat farmers are the driving force behind the EatWheat.org campaign, which aims to create awareness of farm and production practices through the lens of food as identity. And the food that we think can connect best is, of course, wheat. It’s simple. It’s versatile. It’s natural. And it doesn’t matter if it’s homemade for hours, or picked up at the grocery store ready-to-go — it’s a simple and natural way to connect to others and yourself.
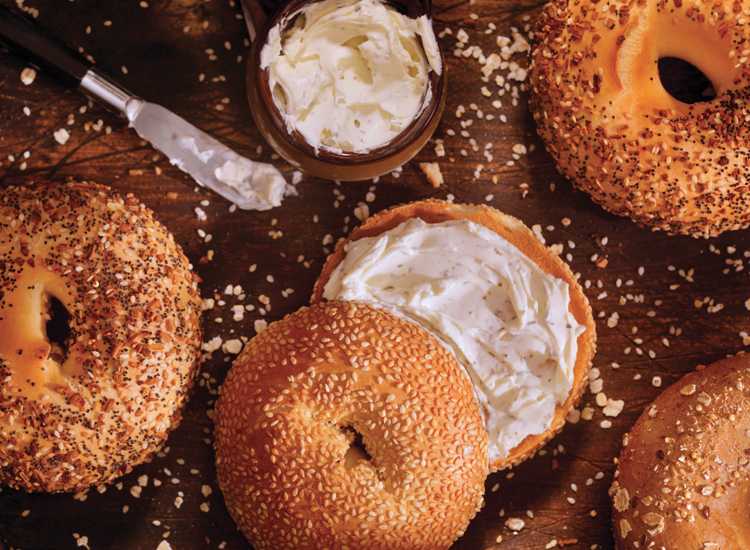
After a year of operation, the good news is that the conversation is working. EatWheat’s Facebook follower count now ranks in the thousands and Instagram is ever-growing. Videos produced sharing the story of American agriculture have garnered tens-of-thousands of views. Fast-paced videos showing quick-and-easy wheat-based recipes have amassed more than 70,000 views on Facebook alone. But the real value in the social media world is the conversations that have been had with consumers who simply want to know where their food comes from.
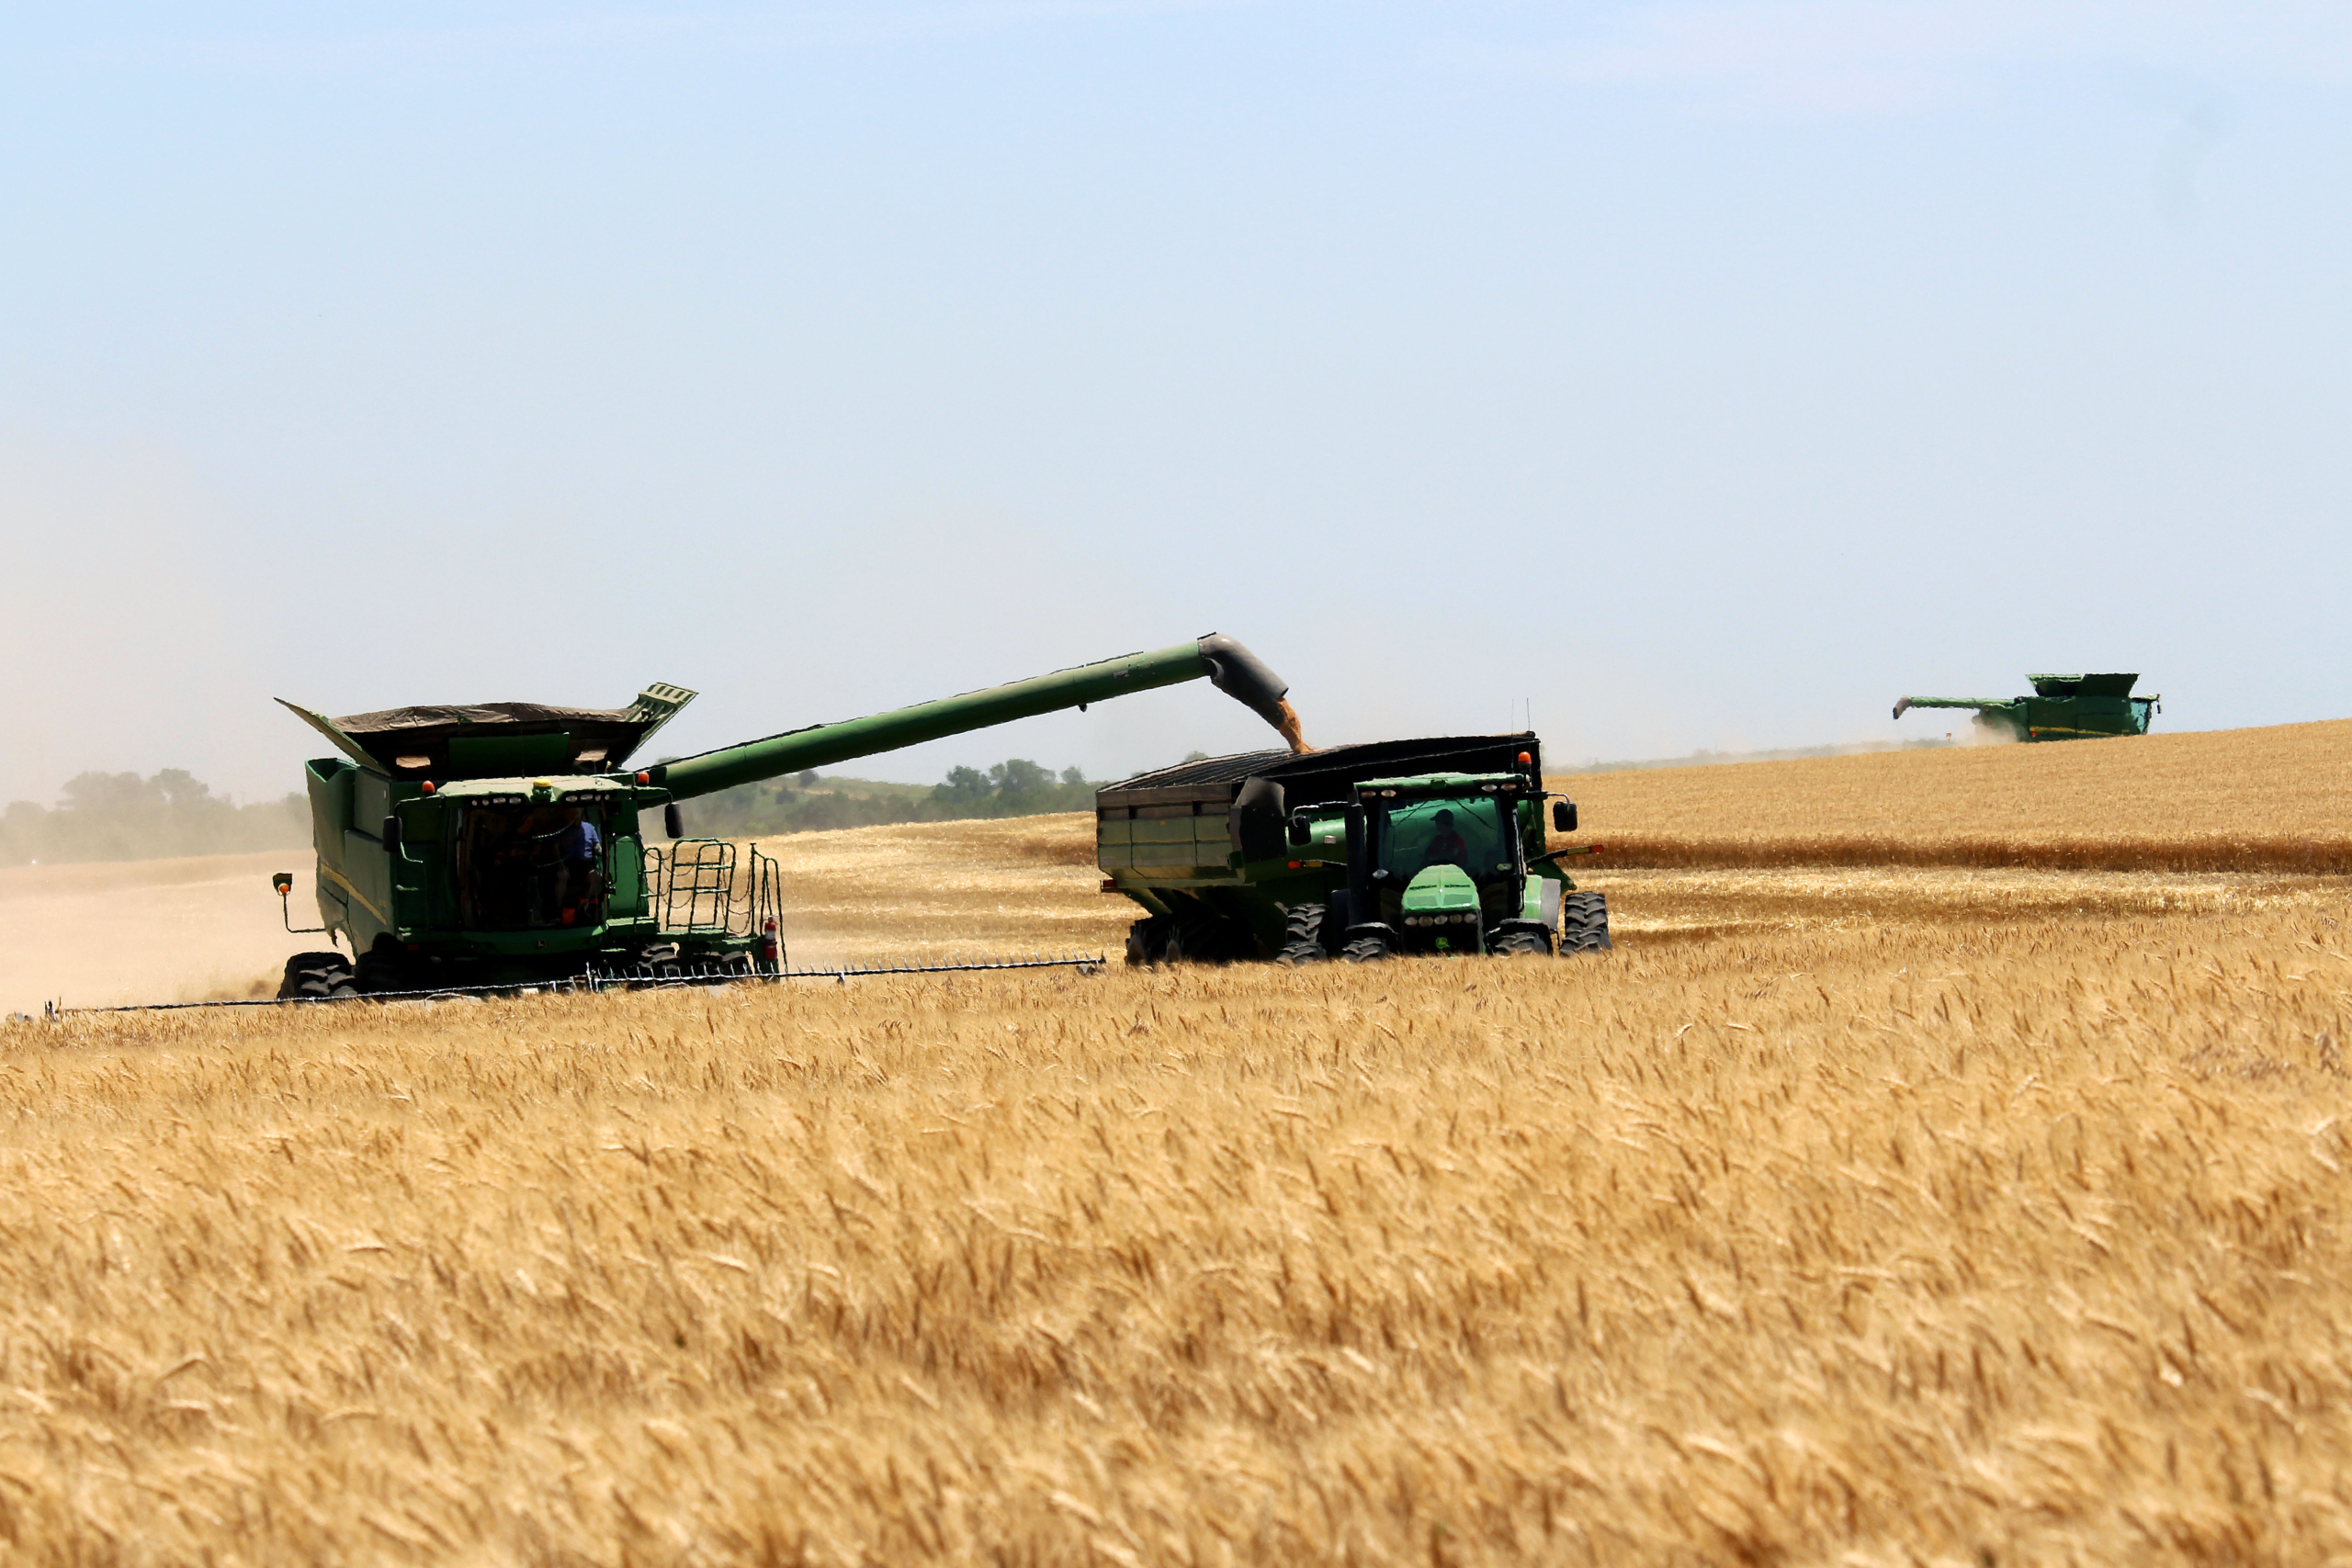
During wheat harvest, nine food bloggers visited a Kansas wheat farm, flour mill and the Kansas Wheat Innovation Center. They baked with fellow blogger and popular cookbook author Zoë François of Artisan Bread in Five Minutes a Day. These bloggers shared their experiences learning about wheat on their blogs and with their 5.4 million social media followers.
More than 120,000 visitors have made their way to EatWheat.org during its inaugural year. These viewers typically come to the website to grab some quick-and-easy recipes, but they stay to learn more about where their food comes from.
EatWheat’s standout traffic performer this first year was Pinterest. The popular Pinterest account has garnered around 3 million views per month on the wheat-based ideas shared on our feed. This totals more than 30 million pairs of eyes on wheat recipes in the last 10 months alone. While not every pin shared on the account comes from EatWheat.org, every pin is wheat related. Every carb-tastic idea seen means that fewer fad diet ideas are shown, which leads to consumers rediscovering wheat in their family’s diets.
Now is the time to have these conversations with consumers. Wheat food consumption is on the rise for the first time in several years. In 2017 wheat for food use rose 14 million bushels over the previous year and flour consumption rose slightly to 131.8 pounds from 131.7 pounds per capita.
If you’re interested in learning more about the EatWheat project, please visit EatWheat.org and amplify these messages by sharing social media posts on Facebook, Instagram and Pinterest.