By Stephanie Bryant-Erdmann, USW Market Analyst

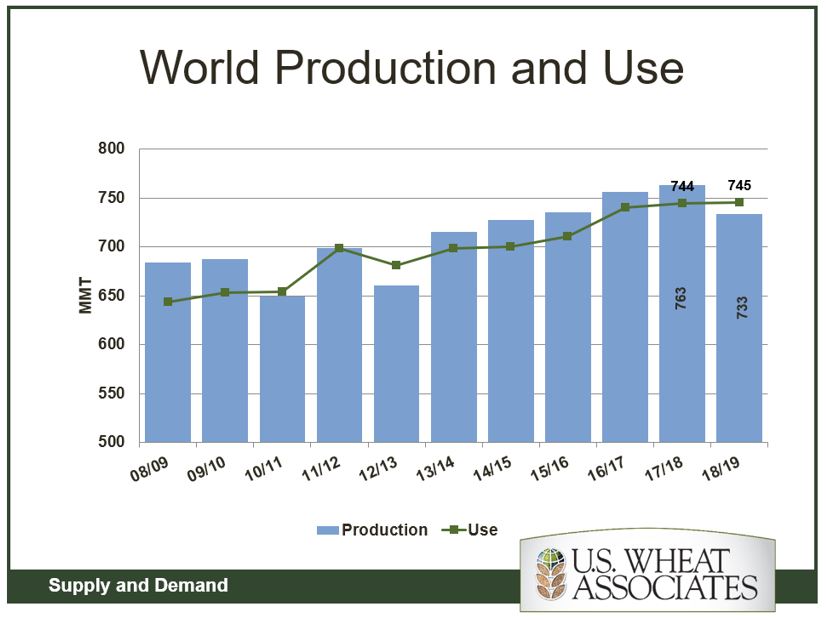
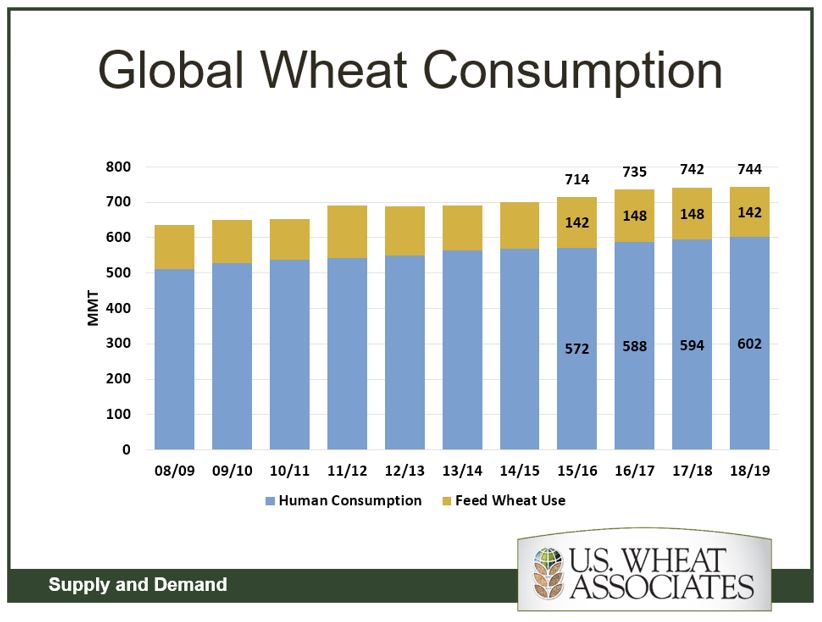
USDA expects global wheat consumption to remain at record high levels in 2018/19 due to increased human consumption. Human wheat consumption is expected to reach a record high 602 million metric tons (MMT), 4 percent above the 5-year average. Over the past ten years, global human wheat consumption has increased 90 MMT, while feed wheat usage has increased 16 MMT.

However, the global supply of milling wheat is expected to fall this year due to challenging growing and harvesting conditions that hurt both quality and yields in many of the major wheat exporting countries. USDA expects global wheat production to fall to the lowest level in 5 years at 734 MMT, down 4 percent from the record high of 763 MMT in 2017/18. If realized, it would be 1 percent below the 5-year average and the first-time global wheat consumption has exceed global wheat production since 2012/13.

The decline in global wheat production is due to decreased production in half of the major wheat exporting countries including the European Union (EU), Russia, Australia and Ukraine. If realized, Russian wheat production would still the third highest on record, but Australian wheat production is expected to fall its lowest level since 2007/08.

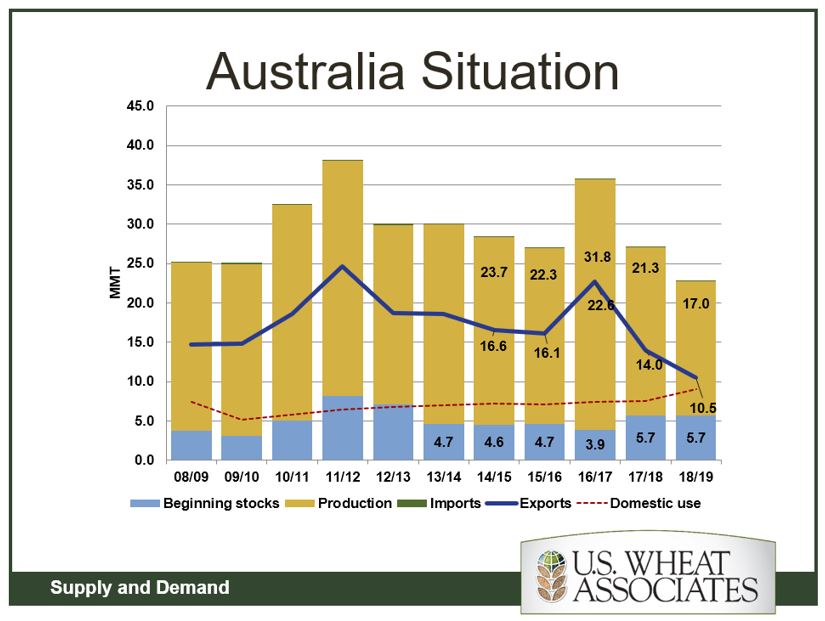
Australian wheat production is expected to fall 18 percent year over year to 17.5 MMT due to consecutive years of devastating drought in New South Wales and Queensland where Australian Prime Hard (APH) and Australia Hard (AH) production is centralized. Increased wheat production in Western Australia is expected to partially offset the decrease from the rest of the country. Australian wheat harvest typically occurs in December. USDA expects Australian exports to decrease to 11.5 MMT, 35 percent below the 5-year average and also the lowest level since 2007/08.

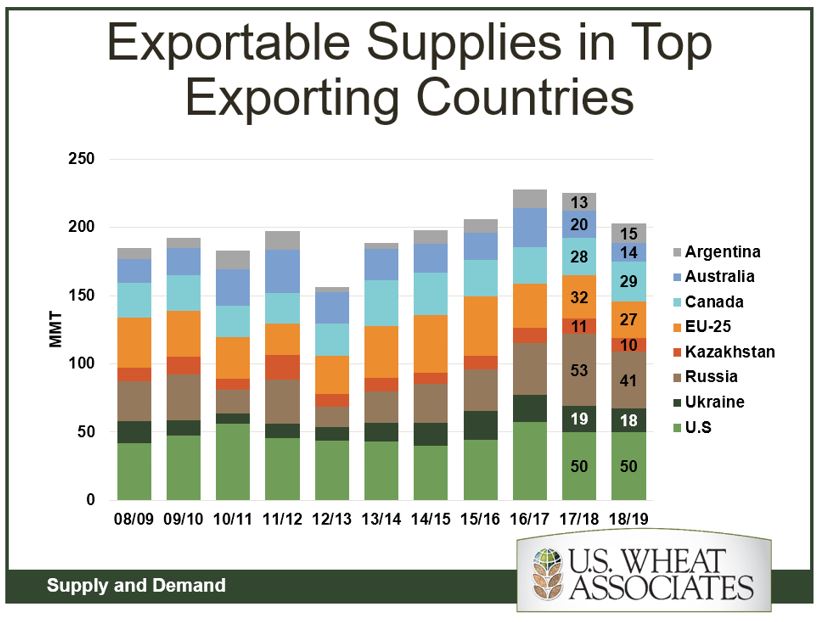
With exportable wheat supplies (production plus beginning stocks minus domestic consumption) decreasing in half of the world’s major exporters, USDA expects the United States to have the largest exportable supply of wheat in the world in 2018/19 at 49.9 MMT.

As a consequence, USDA expects 2018/19 U.S. wheat exports to reach 27.9 MMT, up 14 percent from 2017/18 and 7 percent above the 5-year average, if realized. Still, U.S. wheat export sales pace will need to increase to meet this goal, as year-to-date U.S. wheat export sales total just 13.8 MMT or 49 percent of USDA’s anticipated total.

To learn more about 2018 U.S. wheat quality, visit the USW Crop Quality page.

thumbnail

By Ben Conner, USW Vice President of Policy


Longtime readers of “Wheat Letter” know that there is a certain time of year when the “Wheat Letter” must be opened. When its content must be consumed with abandon. When one must read an article so important that – despite all the other wonderful “Wheat Letter” content provided throughout the year – this alone would justify the subscription.


Ladies and gentlemen, that time is now. This is the “Wheat Letter” post you have been waiting for. This is the one where we spin the tale of the “National Trade Estimate” report.


You ask, what is it about the National Trade Estimate that is so important? Why do you spend hours (days!) every year scouring the world to develop one long submission of trade policy issues to present to the U.S. Trade Representative (USTR)?


I am glad you asked. The straightforward answer is that USTR also asked. In 2019, for the 34th time, USTR will release a report on trade barriers around the world. In preparation, the agency published a “Federal Register” notice asking organizations like ours to catalogue all the policy challenges that disrupt U.S. exports.


While we aimed for brevity, globally dispersed conspirators had other plans. Twenty-three pages later and spanning a dozen countries, we have documented some of the most consequential policies affecting U.S. wheat exports today. These are limited to the policies that we believe to be inconsistent with each country’s World Trade Organization obligations and for various reasons the list is not exhaustive. We talk about domestic support, export subsidies, tariff barriers, non-tariff barriers, phytosanitary problems, and more.


Go ahead, take a look. If you love trade policy as much as me, you may still be bored but it could be helpful. After all, the point of listing these trade barriers is eliminating them. Without attention on barriers, governments will never work to solve them. And solving impediments to trade between U.S. farmers and their overseas customers is what we are all about here on the U.S. Wheat Associates trade policy team.

Originally printed November 6, 2018 by Kansas Wheat; Reprinted with permission

The phrase heard around the agriculture world is “tell your story.” Today most Americans are three generations removed from the farm so tales from the tractor are more important now than ever. Wheat farmers saw this need, and their conduit of conversation, EatWheat.org, is celebrating its first year of operation.

EatWheat allows the wheat industry to speak with one voice in an effort to reclaim the national conversation on wheat and share one primary message amongst numerous influencers while we dismantle the false promises of wheatless diets.

When urban consumers look down at their plate, many don’t know how that food came from the farm to their table. While it may not be a topic of constant thought, many have begun to wonder about the farmers who produce the food they consume and the processes used to create such a bounty.

Kansas wheat farmers are the driving force behind the EatWheat.org campaign, which aims to create awareness of farm and production practices through the lens of food as identity. And the food that we think can connect best is, of course, wheat. It’s simple. It’s versatile. It’s natural. And it doesn’t matter if it’s homemade for hours, or picked up at the grocery store ready-to-go — it’s a simple and natural way to connect to others and yourself.

After a year of operation, the good news is that the conversation is working. EatWheat’s Facebook follower count now ranks in the thousands and Instagram is ever-growing. Videos produced sharing the story of American agriculture have garnered tens-of-thousands of views. Fast-paced videos showing quick-and-easy wheat-based recipes have amassed more than 70,000 views on Facebook alone. But the real value in the social media world is the conversations that have been had with consumers who simply want to know where their food comes from.

During wheat harvest, nine food bloggers visited a Kansas wheat farm, flour mill and the Kansas Wheat Innovation Center. They baked with fellow blogger and popular cookbook author Zoë François of Artisan Bread in Five Minutes a Day. These bloggers shared their experiences learning about wheat on their blogs and with their 5.4 million social media followers.

More than 120,000 visitors have made their way to EatWheat.org during its inaugural year. These viewers typically come to the website to grab some quick-and-easy recipes, but they stay to learn more about where their food comes from.

EatWheat’s standout traffic performer this first year was Pinterest. The popular Pinterest account has garnered around 3 million views per month on the wheat-based ideas shared on our feed. This totals more than 30 million pairs of eyes on wheat recipes in the last 10 months alone. While not every pin shared on the account comes from EatWheat.org, every pin is wheat related. Every carb-tastic idea seen means that fewer fad diet ideas are shown, which leads to consumers rediscovering wheat in their family’s diets.

Now is the time to have these conversations with consumers. Wheat food consumption is on the rise for the first time in several years. In 2017 wheat for food use rose 14 million bushels over the previous year and flour consumption rose slightly to 131.8 pounds from 131.7 pounds per capita.

If you’re interested in learning more about the EatWheat project, please visit EatWheat.org and amplify these messages by sharing social media posts on Facebook, Instagram and Pinterest.

thumbnail

The long run up to the United States midterm election is over and (most) of the votes have been counted. There will be new members of Congress sworn in next January, some that may serve on the committees that focus on agricultural policy. Before then, however, the current Congress has an opportunity to pass the Farm Bill that their committees wrote. If that does not happen, the full trade service and technical assistance that U.S. Wheat Associates (USW) has long provided to overseas wheat buyers and end-users is at risk.

The Foreign Market Development Program (FMD) assists helps U.S. farmers developing new foreign markets and work to promote products in existing markets. The FMD program helps organizations like USW establish the long-term relationships that are so important in today’s international trade environment.

However, the FMD program lost its baseline funding on September 30 when the 2014 Farm Bill expired.  Without a new Farm Bill in place, the market development infrastructure built with FMD and farmer funds is under serious threat, at a time when export promotion is needed most. Without the funding from the FMD program, USW would eventually have to cut back on it activities, short-changing the wheat farmers we represent as well as their overseas customers who benefit from the many service-oriented activities USW conducts.

A coalition of export market development organizations like USW appreciates that the House and Senate Agriculture Committees recognized FMD’s importance and took steps to renew the program and protecting its baseline funding in both versions of the Farm Bill. Without protecting the baseline, export promotion organizations like USW will face serious uncertainty every time a Farm Bill is set to expire because of a law that ends the funding baseline for programs like FMD with budgets of less than $50 million per year. A new Farm Bill can protect the FMD program and the trade service it supports.

This week, the National Association of Wheat Growers (NAWG) called on Congress to pass the Farm Bill as soon as possible, in part because “the economy in rural America is struggling,” said Jimmie Musick, NAWG President and a wheat grower from Oklahoma.

Also this week, the ranking member of the House Agriculture Committee, Rep. Collin Peterson of Minnesota said that because negotiators are getting “relatively close” to an agreement on a final measure that Congress could pass during the lame-duck session, farmers and ranchers can expect a new Farm Bill before the end of 2018.

USW, NAWG, and the U.S. wheat farmers they represent are all hoping that Rep. Peterson is right.


thumbnail

Recent news and highlights from around the wheat industry.

Quote of the Week:The annual U.S. Wheat Associates Crop Quality Report is one of the most useful tools available to buyers of U.S. wheat.” – Vince Peterson, USW President

Best Wishes to Alvaro de la Fuente. Longtime USW Regional Vice President for South America Alvaro de la Fuente has just started what we hope will be a long and enjoyable retirement. We will share some tributes and memories of Alvaro’s successful tenure with USW in Wheat Letter soon. For now though, thank you, Alvaro, for your dedication and service — you will be missed!

Congratulations. We are fortunate to have devoted, loyal colleagues at USW. This month Marketing and Program Coordinator Jin Young Lee, from the USW Seoul Office, is celebrating 25 years. Thank you, Jin Young, for your service to our organization, to U.S. wheat farmers and to our customers around the world.

Farmers Frustrated by Winter Wheat Planting Delays. The waiting game that is winter wheat planting 2018 is about to run out of time. In Kansas – traditionally the nation’s largest producer of winter wheat – the USDA’s Risk Management Agency Planting Deadlines for Kansas ranges from October 15 (northwest Kansas) to November 15 (southeast Kansas). Delays in planting caused by rain have stalled planting progress so far, and could prompt farmers to halt wheat planting altogether and wait until corn, grain sorghum, or soybean planting in 2019. Read the full article from Successful Farming here.

Wheat Marketing Center Seats New Directors, Adds New State. The Wheat Marketing Center (WMC) Board of Directors met last week in Portland for its biannual gathering, where it welcomed two new state representatives to its board. Randy Hinebauch, a wheat farmer from Montana, will represent the Montana Wheat and Barley Committee, while Philip Volk, a wheat farmer from North Dakota, will represent the North Dakota Wheat Commission. The WMC all welcomed the Oklahoma Wheat Commission as a new member to its board. Read the full announcement here.

Northern Crops Institute Welcomes Back Brian Sorenson. The Northern Crops Institute (NCI) recently hired Brian Sorenson for program manager. In his new role, Sorenson will use his background in cereal chemistry, grain milling and grain quality to provide organization and leadership in the development of educational programs to promote northern grown crops to global grain buyers and food processors. He previously served as technical director at NCI from 2001-2008 and director from 2008 to 2011. Read the full announcement here.

National Wheat Foundation Scholarship. The National Wheat Foundation’s Jerry Minore Scholarship honors high school and college students pursuing an agricultural career. “The purpose of the Jerry Minore Scholarship is to help students who are passionate about agriculture at school and at home,” said National Wheat Foundation Chairman Wayne Hurst. “Our students are the future. They will go on to educate the next generation about wheat, agriculture and their role in society.” The application deadline is Dec. 1, 2018. Click here to learn more and apply.

Grain Companies Seek More Efficiency. Archer Daniels Midland Company, Bunge Limited, Cargill, and Louis Dreyfus Co. are investigating ways to standardize and digitize global agricultural shipping transactions and are seeking broad-based industry participation to promote global access and adoption. Initially, they are focused on technologies to automate grain and oilseed post-trade execution processes to encourage shorter document-processing and wait times and better end-to-end contracting visibility. Longer term, the companies want to drive greater reliability, efficiency and transparency by replacing other manual, paper-based processes tied to contracts, invoices and payments, with a more modern, digitally based approach. Read more here.

Cereal Science Events Calendar. Cereal Scientist Dr. M. Hikmet Boyacıoğlu maintains a calendar of events related to the cereal science field. If you wish to receive this calendar, you may email Dr. Boyacıoğlu at [email protected].

Subscribe to USW Reports. USW publishes a variety of reports and content that are available to subscribe to, including a bi-weekly newsletter highlighting recent Wheat Letter blog posts, the weekly Price Report and the weekly Harvest Report (available May to October). Subscribe here.

Follow USW Online. Visit our page at https://www.facebook.com/uswheat for the latest updates, photos and discussions of what is going on in the world of wheat. Also, find breaking news on Twitter at www.twitter.com/uswheatassoc and video stories at https://www.youtube.com/uswheatassociates.

thumbnail

By Erica Oakley, USW Director of Programs

As a key part of its commitment to transparency, each year U.S. Wheat Associates (USW) produces an annual Crop Quality Report that includes grade, flour and baking data for all six U.S. wheat classes. The report is compiled from sample testing and analysis conducted during and after harvest by our partner laboratories. The report provides essential, objective information to help buyers get the wheat they need at the best value possible.

The 2018 USW Crop Quality Report is now available for download in English, Spanish, French and Italian, and will be available in Chinese and Arabic soon. USW also shares more detailed, regional reports for all six U.S. wheat classes on its website, as well as additional information on its sample and collection methods, solvent retention capacity (SRC) recommendations, standard deviation tables and more.

USW’s annual Crop Quality Seminars are already underway and will continue over the next month around the world. USW invites its overseas customers, including buyers, millers and processors, to these seminars led by USW staff, U.S. wheat farmers, state wheat commission staff and educational partner organizations. The seminars dive into grade factors, protein levels, flour extraction rates, dough stability, baking loaf volume, noodle color and texture and more for all six U.S. wheat classes, and are tailored to focus on the needs and trends in each regional market.

In 2018, USW is projected to host 41 seminars in 28 countries.

Customers have previously shared that they use the report throughout the year as a reference manual and to guide them through purchases and future planning. The seminars provide a first look at the overall crop and a deep dive into the data and how to use it. Customers will often use the seminars and report as educational training for new employees.

The reports and seminars have been a traditional part of USW’s strategy since 1959, growing to become its single largest marketing activity.

thumbnail

By Stephanie Bryant-Erdmann, USW Market Analyst

This week, U.S. Wheat Associates (USW) holds its 2018 Fall Board of Directors meeting. At each board meeting, the USW Market Analyst presents an update on world and U.S. wheat supply and demand factors based on information from the U.S. Department of Agriculture, as of Oct. 11, 2018. Following are some highlights from the current report to the board.

  • 2018/19 global wheat production to fall for first time in 5 years.
  • Global supplies estimate to fall to 1,006 million metric tons (MMT); down 1 percent from the 2017/18 record.
  • Wheat production in Australia to fall to 18.5 MMT, 26 percent below the 5-year average.
  • U.S. wheat production estimated at 51.3 MMT, 8 percent above 2017/18.


  • Consumption forecast at a record 746 MMT, 4 percent above the 5-year average.
  • Chinese domestic consumption expected to reach 122 MMT, 5 percent above the 5-year average.
  • U.S. domestic consumption to grow 6 percent year over year to 31.1 MMT.


  • World wheat trade projected at 180 MMT, 4 percent above the 5-year average.
  • Australian exports to drop to 13.0 MMT, 10 percent below 2017/18, and the lowest level since 2007/08.
  • Exports from Russia to fall 15 percent year over year 35.0 MMT, still 28 percent above the 5-year average.
  • U.S. 2018/19 exports to increase to 27.9 MMT, up 14 percent from 2017/18, if realized.


  • World beginning stocks estimated at record 275 MMT, up 7 percent year over year.
  • Beginning stocks in Argentina forecast at 1.00 MMT, down 42 percent the 5-year average.
  • U.S. beginning stocks will fall to an estimated 29.9 MMT, 7 percent below 2017/18 levels.


  • Global ending stocks projected at 260 MMT, 5 percent below the record 2017/18 level, if realized.
  • Estimated Chinese ending stocks of 136 MMT account for 52 percent of global ending stocks.
  • Exporter ending stocks forecast at 58.8 MMT, down 24 percent year over year.
  • Ending stocks in importing countries to fall to 65.6 MMT, 15 percent below the 5-year average of 76.8 MMT.


  • Total U.S. wheat export sales for 2018/19 predicted to reach 27.9 MMT.
  • As of Oct. 11, 2018/19, U.S. wheat export sales were 18 percent behind last year’s pace.
  • About 27 percent of that difference represents temporary loss of the Chinese market.
  • Sales of soft red winter and durum are ahead of last year’s pace.


thumbnail

By Elizabeth Westendorf, USW Assistant Director of Policy

In its 2018 Global Agricultural Productivity (GAP) Index, the Global Harvest Initiative has reported that food production growth is not keeping up with the rising population pressures. The past four years, the index has reported a similar trend, and that gap is widening.

This is one reason why the theme of The 2018 World Food Prize and Borlaug Dialogue Oct. 15 to 19 in Des Moines, Iowa, was “Rise to the Challenge.” According to World Food Prize Foundation President Ambassador Kenneth Quinn, the theme references “the single greatest challenge in human history…whether we can sustainably feed the 9 billion people who will be on our planet in 2050.”

More than over 1,200 people from over 65 countries attend this annual event. The 2018 World Food Prize Laureates honored there were Dr. Lawrence Haddad and Dr. David Nabarro for their work to elevate maternal and child undernutrition in policy discussions and with development groups around the world.

This year’s Borlaug Dialogue focuses significantly on nutrition challenges, and speakers included Her Excellency Mercedes Araoz, Vice President of Peru; former U.S. Secretary of Agriculture Dan Glickman; Daniel Voytas, Chief Science Officer of Calyxt; Rob Bertram, Chief Scientist at USAID’s Bureau of Food Security; Martin Kropff, Director General of CIMMYT; Sir Gordon Conway; James Collins, Chief Operating Officer for Corteva Agriscience™; Ted McKinney, Under Secretary of Agriculture for Trade and Foreign Affairs; and Randal Kirk, CEO of Intrexon.

The first 1,000 days of life, which encompasses the period of a child’s life from pregnancy to its second birthday, is the most critical developmental period for children. Malnutrition in this window can lead to irreversible damage to a child’s brain development and physical growth, resulting in developmental delays and stunting. It also increases their risks of diseases later in life, including heart disease and diabetes.

For this reason, food security cannot be a conversation about increasing calories alone. It is vital that nutrition security is part of that discussion and part of any solution. By fighting malnutrition in women and young children, it is possible to break up the insidious cycle in which malnourished mothers give birth to malnourished daughters, who then grow up to be undernourished mothers. This not only benefits women, but also a country’s entire economy.

Wheat is a staple crop around the world and is thus an important part of this conversation. Not only does wheat make up 20 percent of calories in global diets, it also makes up 20 percent of protein on average. Additionally, whole wheat and fortified white flour provides essential nutrients, including niacin and iron. Fortified flours also include folic acid, thiamin, essential B vitamins and riboflavin. Whole wheat products are a great source of fiber and are naturally low in fat. They also contain key nutrients like selenium, potassium and magnesium.

U.S. Wheat Associates is proud to help our farmers’ high-quality wheat reach customers around the world, and we are also proud of our continued engagement on food security issues. Find more information about our policies and activities online here.

thumbnail

Happy World Pasta Day! What a perfect day for U.S. Wheat Associates (USW) to share an overview of the 2018 U.S. Northern Durum and Desert Durum® crop quality results. Analysis shows the Northern durum crop is sound with high protein and excellent kernel characteristics. Vitreous kernel count and average kernel size are high and quality is balanced across the region. Desert Durum® production is down this year, though the 2018 crop will deliver the valuable milling, semolina and pasta quality traits that customers have learned to expect and appreciate.

Here is a summary of test results for Northern durum and Desert Durum®. As always, USW reminds buyers to be diligent with contract specifications to ensure they receive the quality they need.

Northern Durum

Weather and Harvest: A favorable growing season pushed yields to near record levels; production was up almost 60 percent compared to 2017. As with the hard red spring crop, mid-season rain boosted crop conditions and yield potential. Harvest was complete in most areas by late September.

Wheat and Grade Data: The crop average grade is U.S. No. 1 Hard Amber Durum (HAD) with average test weight of 61.4 lbs/bu (79.9 kg/hl) and average total kernel defects of 1 percent. The average vitreous kernel content is 90 percent, up from both last year and the 5-year average, with more than half of the crop above 90 percent vitreous compared to 45 percent in 2017.

Regional average protein is 14.5 percent on a 12 percent moisture basis (12% mb), equal to 2017 and slightly above the 5-year average. The crop average thousand kernel weight (TKW) is 41.2 g, the heaviest in six crop years, and the percent of large kernels is notably higher than a year ago. The average falling number is 425 sec. Although disease pressure was slightly higher in 2018 compared to 2017, DON was undetectable or <0.5 ppm in the samples analyzed.

Semolina and Processing Data: The Buhler laboratory mill average total extraction of 74 percent and semolina extraction of 69.3 percent are both higher than last year and the 5-year averages. The milled product ash and speck counts are also higher than last year and the 5-year averages. The gluten index average is 57.1 percent compared to 86.3 percent in 2017. Last year’s drought conditions supported exceptionally high gluten index values, while the 2018 values are more typical.

Semolina and cooked spaghetti evaluations show similar semolina color values to a year ago, but lower dry pasta color. Mixing properties are slightly weaker and cooked firmness values are similar to the 5-year averages. The higher extraction levels and higher ash levels on the Buhler lab mill may have contributed in part to the lower color scores on the dry pasta. Evaluation of the cooked spaghetti shows slightly lower firmness than 2017, but higher than the 5-year average.

Desert Durum®

Wheat and Grade Data: In 2018, the average grade is No. 1 Hard Amber Durum (HAD). Test weight average was 62.8 lbs/bu (81.8 kg/hl). The average vitreous kernel content (HVAC) is 98.0 percent, a high average typical of Desert Durum®. Average damaged kernels are 0.2 percent and total defects are 0.6 percent. Desert Durum® is characterized by its kernel low moisture content, and this year’s average was 6.7 percent. Protein content average was 13.4 percent (12% mb).

Semolina and Processing Data: The semolina b* value was 30.5, similar to 2017 b* value of 30.9.  Wet gluten of 32.3 percent and gluten index of 75 percent. Semolina Mixograph score was 8 and Alveograph W value was 231 (10-4 Joules), both of which indicate high strength.  Pasta color b* value was 44 and score was 9.6. Pasta cooked firmness was 6.9, significantly higher than 2017.

View the full report for Desert Durum® here.
View the full report for San Joaquin Valley Durum here.
View the full report for Sacramento Valley Durum here.

thumbnail

Growing conditions over most of the U.S. hard red spring (HRS) wheat production area helped produce a 2018 crop with many positive features for buyers. There is greater supply of high-grade HRS with above average protein levels and very good dough and bake qualities. In general, many quality features are balanced across the region with some variation in grade factors, DON and dough strength.

At an estimated 16.0 million metric tons (MMT), this is the largest HRS crop in 22 years and up significantly from 2017 with higher planted area and a record national average yield.

Here is a summary of the season and test results, with full data available online soon and in upcoming USW Crop Quality Seminars. As always, U.S. Wheat Associates (USW) reminds buyers to be diligent with contract specifications to ensure they receive the quality they need.

Weather and Harvest: Planting began in late April, later than normal, and continued to be slow until mid-May. Most of the crop was planted by early June. Then rain established a robust stand and good early growth. Drier conditions later in the season accelerated maturity and harvest started in late July; most of the crop was harvested by mid-September.

Wheat and Grade Data: The average grade is a U.S. No. 1 Dark Northern Spring (DNS), up from U.S. No. 1 Northern Spring (NS) in 2017. The overall average test weight is 62.2 lb/bu (81.7 kg/hl), higher than in 2017 and the 5-year average. Average damage is 0.3 percent, up from 2017, and shrunken and broken kernels average is 1.0 percent, similar to 2017. The crop shows excellent kernel color with average vitreous kernel content (DHV) of 87 percent compared to 71 percent for the 5-year average. Average DHV is 90 percent for Western samples and 84 percent for Eastern.

The average protein is 14.5 percent (12 percent mb), similar to 2017. Western average protein is 14.6 percent, down slightly from 2017, while Eastern average protein held steady at 14.4 percent.

Disease pressures were higher than in 2017. The overall DON average is 0.3 ppm, ranging from 0.0 to 0.2 ppm for Western composites and from 0.5 to 0.7 ppm for Eastern composites. Thousand kernel weight (TKW) is slightly higher than 2017 at 31.1 grams. A dry harvest period supported a high average falling number of 399 sec, indicating sound wheat.

Flour, Dough and Baking Data: Buhler laboratory mill flour yield averages 67.8 percent, down 3.5 percent from 2017, but similar to the 5-year average. Flour ash fell to 0.52 percent, compared to 0.58 percent a year ago. Wet gluten averages 35.3 percent. Amylograph values average 635 BU for 65 g of flour, up notably from 2017 and the 5-year average.

Farinograph dough tests indicate slightly higher absorption than last year with the Western region average at 65.2 percent and Eastern at 63.0 percent. The average farinograph stability is 10.8 min, similar to 2017 and the 5-year average. The Eastern crop has slightly stronger dough properties compared to the Western, but dough strength increases at higher protein levels in both regions.

Alveograph and extensograph analyses show more resistance and less extensibility. The average alveograph P/L ratio is 0.61 compared to 0.72 in 2017, and the W value is 415 (10-4 J) compared to 360 in 2017. The overall extensibility and resistance to extension of the 135 min extensograph are 13.2 cm and 855 BU compared to 2017 crop values of 13.5 and 770.

The average loaf volume is 973 cc, up marginally from 968 in 2017 with Western volumes down slightly but Eastern volumes higher. Average bake absorption is 69.6 percent, up sharply from both last year and the 5-year average. Bread scores are slightly lower in both Western and Eastern crops compared to 2017.