thumbnail

Three and a half months into marketing year 2019/20, total U.S. export sales* as of Oct. 15 of 13.8 million metric tons (MMT), 14 percent ahead of last year’s pace. Sales to four of the top 10 U.S. wheat customers are ahead of last year’s pace. Export sales to Mexico, the top U.S. customer over a five-year period, are up 50 percent year-over-year at 2.09 MMT. Sales to Nigeria total 936,000 metric tons (MT), up sharply from the 569,000 MT sold this time last year. All U.S. wheat classes except hard red spring (HRS) and white wheat are ahead of last year’s pace. USDA projects 2019/20 U.S. wheat exports will rise to 25.9 MMT. If realized, this would be 1 percent higher than 2018/19.

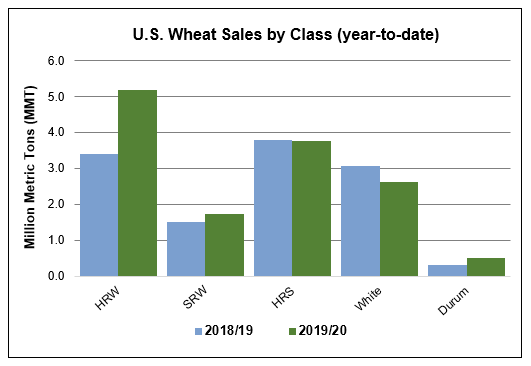
HRW. USDA reported hard red winter (HRW) year-to-date exports at 5.13 MMT, 52 percent ahead of the 2018/19 HRW sales pace on the same date. Mexico is currently the number one HRW purchaser and HRW sales to Mexico are 54 percent ahead of last year’s pace. As of Oct. 10, HRW sales to Mexico totaled 1.27 MMT. Sales to Nigeria are more than double last year’s pace at 567,000 MT. Japanese HRW purchases total 488,000 MT, up 7 percent from 2018/19.

SRW. 2019/20 soft red winter (SRW) sales are up 14 percent year-over-year at 1.72 MMT. Sales to 4 out of 5 of the top buyers of U.S. SRW are ahead of last year’s pace. Year-to-date, Mexico has purchased 550,000 MT, 15 percent more than last year. Nigerian SRW purchases total 142,000 MT, 50 percent ahead of last year’s pace. Sales to other Latin American countries, including Trinidad and Tobago and Panama are also ahead of 2018/19 exports.

HRS sales of 3.77 MMT are only 1 percent behind the last year’s pace. As of Oct. 10, buyers in Taiwan purchased 353,000 MT, up 5 percent from 2018/19. Taiwan is the third-largest buyer of HRS. Sales to South Korea, the fourth-largest buyer of HRS, are up 10 percent from last year at 294,000 MT. Year-to-date sales to Southeast Asian countries, including the Philippines, Bangladesh, Thailand and Malaysia, are behind last year’s pace. This time last year, there were no HRS sales to China. So far in 2019/20, the U.S. has sold 63,000 MT of HRS to China.

White. As of Oct. 11, exports of all white wheat (including soft white and hard white) are down 14 percent year-over-year at 2.62 MMT. Sales to 4 out of the top 5 customers of U.S. white wheat are down from last year. Sales to the Philippines, the largest customer of soft white (SW) wheat, are down 6 percent from 2018/19 at 660,000 MT.  SW food aid donations to Yemen are up 79 percent from this time last year at 231,000 MT. Minimal access to the Chinese market is also impacting SW sales. In 2017/18, China had purchased 271,000 MT of SW by this date.

It should be noted that the white sales to Nigeria of 123,000 MT are hard white (HW). USDA does not differentiate between the 2 classes on the Export Sales Report. HW sales to Nigeria in 2019/20 are 9 percent ahead of last year’s pace.

Durum. Year-to-date durum exports total 497,000 MT, up 59 percent from the same time last year. To date, the European Union (EU), Algeria and Nigeria are the top durum buyers. Year-to-date sales to the EU total 269,000 MT (9.88 million bushels), more than double last year’s pace. Italy is the top durum buyer in the EU. U.S. durum sales to Italy are up 165 percent from last year at 248,000 MT. Increased sales to the EU more than offset decreased sales to Algeria and Nigeria. Algerian durum sales are down 30 percent from last year at 45,000 MT and Nigerian durum sales are down 58 percent from 2018/19 at 28,000 MT. There is also a significant portion of these 2019/20 durum sales currently designated as “sales to unknown destinations.”

*U.S. Wheat Associates (USW) publishes a new Commercial Sales report every Thursday documenting wheat export sales-to-date by country and class for the current marketing year compared to the previous marketing year on the same date. The report also includes a 10-year commercial sales history by class and country. Data is sourced from the USDA Foreign Agricultural Service Weekly Export Sales Report.

thumbnail

Recent news and highlights from around the wheat industry.

Speaking of Wheat:Adios South America! We hosted 5 seminars in 5 different cities and in 3 different countries. We made contact with about 100 buyers, technical staff, or managers of mills to tell them the story of the 2019 [U.S. wheat] crop. I couldn’t ask for a better team to travel with and get to know a little better.” – Jason Scott, Maryland Wheat Farmers and USW Past Chairman, commenting on his participation in 2019 USW Crop Quality Seminars in Brazil, Colombia and Peru.

U.S. Wheat Exports Up for the Week. USDA reported export sales of U.S. wheat for the week ending Oct. 24 at 493,700 metric tons (MT), toward the high end of trade expectations for 200,000 to 500,000 MT. USDA note total known outstanding sales and accumulated exports of all U.S. wheat classes for the 2019/20 marketing year to date were 14.6 million metric tons (MMT), 11 percent greater than last year’s year-to-date total of 13.1 MMT. See USW’s Commercial Sales Report online here.

Another Decline in U.S. Wheat Planted Area? “Dogged by lower prices and tepid demand, U.S. wheat farmers are poised to plant the fewest acres of winter varieties in 110 years,” reported Bloomberg in a story about a survey of farmers. The business news service sites abundant global supplies, farm gate winter wheat prices that are less than corn (maize) prices in some areas and late soybean harvest interrupting some double crop opportunities.

November is National Bread Month. November is a great time for pumpkin spice and everything nice, but it’s also the perfect time to celebrate National Bread Month. Both whole grain flour and enriched flour are important to maintaining a healthy diet. The USDA Dietary Guidelines recommend that at least half of the five to eight servings of grains consumed daily should come from whole grain sources. Read more from the Kansas Wheat Commission here.

Registration for 2020 Agricultural Outlook Forum. This week USDA has opened registration for the 96th annual Agricultural Outlook Forum (AOF), its largest event of the year on Feb. 20 to 21, 2020, at the Crystal Gateway Marriott Hotel in Arlington, Va. “The Innovation Imperative: Shaping the Future of Agriculture” sessions will focus on innovations in agriculture, global trade trends, food loss and waste, frontiers in conservation, and the science of food safety. More information will be released in November. USW is a cooperator with USDA’s Foreign Agricultural Service.

National Wheat Foundation Scholarship Applications are due by Dec. 1, 2019. The Jerry Minore Scholarship is awarded to deserving high school or college students pursuing a career in agriculture for the 2019/2020 academic year. This year the Foundation will be issuing two scholarships for $2,500 each.

Subscribe to USW Reports. USW publishes a variety of reports and content that are available to subscribe to, including a bi-weekly newsletter highlighting recent Wheat Letter blog posts, the weekly Price Report and the weekly Harvest Report (available May to October). Subscribe here.

Follow USW Online. Visit our page at https://www.facebook.com/uswheat for the latest updates, photos and discussions of what is going on in the world of wheat. Also, find breaking news on Twitter at www.twitter.com/uswheatassoc and video stories at https://www.youtube.com/uswheatassociates.

thumbnail

By Elizabeth Westendorf, USW Assistant Director of Policy

A recent decision by Japan’s Consumer Affairs Agency is a great step forward for innovative breeding methods that can help farmers address some of the world’s most urgent challenges.

The agency announced that Japan’s government will not require special labeling for products derived from plant breeding innovation, such as gene editing, that do not contain foreign DNA. Japan has a history of skepticism toward new agricultural technology. For example, it requires products that include transgenic traits be labeled as such. The Consumer Affairs Agency’s decision is important because it helps add clarity to how gene editing may be regulated and supports advanced technology development.

That is good news for agriculture in general, even more so for wheat production specifically. Unlike other major row crops in the U.S., there are no wheat varieties with commercialized GM traits. That means farmers do not have access to the seed technology that has helped others. We see this disadvantage in declining acres and in a slower pace of yield increases compared to soybeans, corn and other crops U.S. farmers can grow. Gene editing provides a safe and efficient way to make targeted improvements in new wheat varieties that respond to environmental stressors, combat plant disease, and benefit millers and consumers alike. However, these benefits are only possible when regulations are based in science rather than rooted in fear.

With changing climates, severe weather events, and perennial concerns like drought, disease, and pests, it is imperative that the world’s farmers have access to the best tools available. And this includes their seed. With those tools, we can ensure that U.S. farmers are providing the highest possible quality wheat consistently and reliably for years to come.

For more information about a growing understanding of DNA and advanced breeding methods in agriculture, and to learn how innovations such as gene editing can benefit our planet, our health and our food, visit www.innovature.com.

thumbnail

As a key part of its commitment to transparency and trade service, U.S. Wheat Associates (USW) produces an annual Crop Quality Report that includes grade, flour and baking data for all six U.S. wheat classes. The report compiles comprehensive data from analysis of hundreds of samples conducted during and after harvest by our partner organizations and laboratories. The report provides essential, objective information to help buyers get the wheat they need at the best value possible.

The 2019 USW Crop Quality Report is now available for download in English, Spanish, French and Italian, and will be available in Chinese and Arabic soon. USW also shares more detailed, regional reports for all six U.S. wheat classes on its website, as well as additional information on its sample and collection methods, solvent retention capacity (SRC) recommendations, standard deviation tables and more. Download these reports and resources from the website here.

USW’s annual Crop Quality Seminars are already underway and will continue over the next month around the world. USW invites its overseas customers, including buyers, millers and processors, to these seminars led by USW staff, U.S. wheat farmers, state wheat commission staff and educational partner organizations. The seminars dive into grade factors, protein levels, flour extraction rates, dough stability, baking loaf volume, noodle color and texture and more for all six U.S. wheat classes and are tailored to focus on the needs and trends in each regional market.

In 2019, USW is projected to host 43 seminars in 41 countries, including official seminars in the South America region for the first time in several years.

Customers have previously shared that they use the report throughout the year as a reference manual and to guide them through purchases and future planning. The seminars allow U.S. and USW experts to interpret the data and how to use it. Customers will often use the seminars and report as educational training for new employees.

The reports and seminars have been a traditional part of USW’s strategy since 1959, growing to become its single largest marketing activity.

Look for updates from the 2019 USW Crop Quality Seminars on Facebook and Twitter.

thumbnail

Durum production in the U.S. Northern Plains is down from 2018 with a reduction in overall quality due to historic late season rain and snow that also interrupted harvest. Due to the unusual conditions, the entire crop is not represented in this year’s data. Buyers should be extra vigilant and evaluate the importance of each factor for their end-use needs. Premium contract specifications will command higher prices, but good value can be obtained with diligent contract specifications. Ample carryover supplies from the excellent quality 2018 crop will be helpful in meeting traditional quality needs of buyers, but some parameters may still prove challenging.

That is a summary of northern durum crop quality from the upcoming U.S. Wheat Associates (USW) 2019 Crop Quality Report. Desert Durum® data is reported separately. The National Agricultural Statistics Service collected 166 samples from North Dakota and Montana and the Durum Quality Lab at North Dakota State University analyzed the samples. Funding for the annual survey come from USW member state wheat commissions and the USDA Foreign Agricultural Service. Complete 2019 crop quality data for all six U.S. wheat classes will soon be available online and at annual USW Crop Quality Seminars.

Weather and Harvest: Planting began in early May and ended the first week of June; crop emergence was slow. Mid-season rain boosted development and yield potential. Harvest began late, in mid-August, but with historic rainfall levels, less than 50% of the crop had been harvested by mid-September. The adverse weather continued into October, including periods of heavy snow, compromising quality on a large portion of the crop.

Regional production is estimated at 52 mil bu (1.4 MMT), down 20% from 2018. Final production will likely be lower than current estimates, as roughly 20% of the crop remained unharvested as of mid-October. With only 77% of expected samples collected and analyzed, and a higher than normal percentage of the crop moving directly into feed channels, this report does not represent the entire crop.

Wheat and Grade Data: The surveyed crop averages a U.S. No. 2 Amber Durum (AD) and 37% grades a U.S. No. 1 or 2 Hard Amber Durum (HAD), down from 86% a year ago. Average test weight of 61.1 lbs/bu (79.6 kg/hl) is similar to 2018 and above the 5-year average. Total kernel defects average of 3% is higher than 2018 and the 5-year average, likely due to elevated disease pressures and damage from the prolonged harvest.

The average vitreous kernel (HVAC) content is 64%, down sharply from 90% in 2018 due to harvest rains and localized lower protein levels. The average protein of 13.9% (12% mb), is equal to the 5-year average, but down from 2018. Distribution data shows that nearly 25% of the crop is above 90% HVAC and 38% is above 75% HVAC.

Excellent conditions during kernel development are reflected in the crop average thousand kernel weight (TKW) of 44 g and the percent of large kernels notably higher than last year and 5-year averages. The average falling number value is 345 sec compared to 425 in 2018 with 75% of the crop above 300 sec. Disease pressures were higher in 2019, with some areas impacted by Fusarium. The crop average DON is 0.6 ppm, up from 0.2 last year, but slightly below the 5-year average.

Semolina and Processing Data: Milling for the 2019 survey was performed on a Quadromat® Junior mill, limiting direct comparisons to the Buhler laboratory mill used previously. Semolina extraction is 57.5%, down sharply from 2018, likely attributed to the notable decline in vitreous kernels and shift in milling equipment. The milled product is showing a marked decline in ash levels, 0.6%, with just a slight increase in speck counts compared to 2018. Gluten index values are higher, at 67%, compared to 57% in 2018.

Semolina and cooked spaghetti evaluations show lower values compared to last year and the 5-year average. Semolina color values are lower for both color and brightness, and cooked pasta scores are also lower. Mixing properties reveal a stronger crop with an average mixogram of 6.4 compared to 5.3 in 2018. Cooked pasta evaluations show higher cooked weight compared to the 5-year average, but also higher cooking loss and less cooked firmness.

thumbnail

The 2019 U.S. hard red spring wheat (HRS) crop is one of contrasts with above average yields and high protein, but with key kernel parameters impacted by harvest rains. Due to the unusual harvest conditions and delay, the entire crop is not represented in this year’s data. Functional performance of the 2019 crop shows weaker dough properties and lower absorption but excellent baking properties. Premium quality will command higher prices, but good value can be obtained with diligent contract specifications. Ample carryover from the excellent quality 2018 crop will be helpful in meeting traditional quality needs of buyers.

That is a summary of the major regional results for HRS from the upcoming U.S. Wheat Associates (USW) 2019 Crop Quality Report. The HRS Wheat Quality Lab at North Dakota State University collected and analyzed 781 HRS samples collected from Minnesota, North Dakota, South Dakota, Montana, Idaho and Washington state. Funding for the annual survey come from USW member state wheat commissions and the USDA Foreign Agricultural Service. Complete 2019 crop quality data for all six U.S. wheat classes will soon be available online and at annual USW Crop Quality Seminars.

Weather and Harvest: Planting begin in late April and was slow but ended in early June. Frequent and widespread rains developed across the region in mid-June, boosting yield potential but also elevating disease pressures. Harvest began slowly in mid-August with about 50% of the crop harvested by Sept. 1. By mid-September, record rains interrupted harvest and affected the quality of the remaining crop. About 10% of the crop will not be harvested. Regional production is estimated at 559 mil bu (15.2 MMT), up 8% percent from the 5-year average but down 5% from 2018 on reduced planted area.

Wheat and Grade Data: For the portion of the crop surveyed, the average grade is U.S. No. 1 Northern Spring (NS), down from No. 1 Dark Northern Spring (DNS) in 2018; 85% of Eastern Region samples and 87% of Western Region samples grade U.S. No. 1.  Average test weight of 60.7 lb/bu (79.8 kg/hl) is lower than 2018 and the 5-year average. Average damage is 1.0%, up notably from 2018 with higher damage levels in Eastern samples. Overly wet harvest conditions resulted in a very low vitreous kernel (DHV) average of 52% compared to the 5-year average of 74%. Average DHV is 61% for Western samples and 44% for Eastern.

Even with record yields and low DHV, the crop averages 14.4% (12% mb) protein, similar to 2018 and slightly above the 5-year average, which adds value to the crop. Western average protein is 14.4%, down marginally from 2018, while Eastern average protein held steady at 14.3%. One-half of all samples have greater than 14.5% protein in 2019 with just 18% below 13.5% protein.The heaviest pressure from Fusarium head blight occurred across southern parts of the region. The crop’s overall DON average is 0.6 ppm, up from 0.3 ppm in 2018. Average thousand kernel weight (TKW) is 31 g, similar to the 5-year average. Falling numbers (FN) across the entire region averaged 339 sec, down from 403 in 2018.

Flour, Dough and Baking Data: Buhler laboratory mill flour yield averages 68.4%, higher than 2018 and the 5-year average. Flour ash increased slightly to 0.54%, compared to 0.52% a year ago. Wet gluten averages 34%, slightly lower than 2018. Amylograph values average 406 BU for 65 g of flour, down sharply from 2018 and the 5-year average, with the lowest values in Eastern samples.

Farinograph indicates the crop has 1.3 percentage point lower absorption compared to 2018, but similar to the 5-year average, with Western area average at 63.6% and Eastern area at 62.1%.  The average farinograph stability is 10.1 min, lower than 2018 and the 5-year average. Dough strength is similar across the region with the Eastern crop declining more compared to the 2018 crop and with no correlating increase at higher protein levels; the Western area does show increased dough strength at higher protein levels.

Alveograph and extensograph analyses show more extensibility and less resistance. The average alveograph P/L ratio is 0.61 compared to 0.72 in 2018, and the W-value is 342 (10-4 J), down from 415 last year. The overall extensibility and resistance to extension of the 135 min extensograph are 15.6 cm and 639 BU, notably more extensible than 2018 crop values of 13.2 and 855.

The average loaf volume is 1026 cc, up notably from 973 in 2018; Western area averages 1004 cc and Eastern area averages 1046 cc. Average bake absorption is 67.6%, down from 2018 but higher than the 5-year average. Bread scores are similar to 2018 with the Western area scoring slightly higher than the Eastern area.

thumbnail

Recent news and highlights from around the wheat industry.

Speaking of Wheat: “Wheat is something that touches lives across the world every day, from the Kansas farmer to the suburban mom to children in developing countries. For our family, wheat is ingrained in our heritage and is a proud cornerstone of our business, so we are honored to give back to the industry that has blessed us with so much.” – The Jack and Donna Vanier Family, commenting about their recent donation of $1 million to the Kansas Wheat Commission Research Foundation. Read more here.

Sourdough Growth Seminar. Wheat Marketing Center (WMC) has announced this seminar by Dr. Lin Carson on Dec. 11, 2019. Learn about the art and science of sourdough bread! This popular dough is simple yet complex to produce. This seminar covers the science of fermentation, key ingredients, and the possibilities for innovation with starters. Plus, learn about grains and whole grains in sourdough. Click here to learn more and register: https://www.wmcinc.org/event/sourdough/.

NAWG CEO Honored. National Association of Wheat Growers (NAWG) CEO Chandler Goule was recently named a recipient of the 2019 CropLife America (CLA) Annual Jay Vroom Agricultural Ambassador Award. The award honors a member or an allied organization to CLA who has made a major contribution to public education about pesticides and their contribution to a safe, affordable and sustainable food supply. Goule said “I really appreciate being nominated for the award and to CropLife for bringing awareness to the importance of educating the public on such complicated issues as pesticides.” Read more here.

NAWG Hires New Government Relations Representative. NAWG recently announced that Jake Westlin had joined its staff as Government Relations Representative. In this role, Westlin will support the policy team and provide key research on NAWG’s policy priorities. Read the full release here.

“60 Minutes” Report on U.S. Farm Challenges. The iconic U.S. CBS television news program interviewed Beth Ford, CEO of the U.S. farmer cooperative Land O’Lakes, about the changing landscape of U.S. farms and farming. It is an objective, important look at the challenges facing farmers today and the opportunities technology offers. Read more and watch the segment online here: https://cbsn.ws/2oZDH3E.

Photosynthesis Olympics. In a new study, scientists put elite wheat varieties through a sort of “Photosynthesis Olympics” to find which varieties have the best performing photosynthesis. This could ultimately help grain growers to get more yield for less inputs in the farm. “In this study we surveyed diverse high-performing wheat varieties to see if their differences in photosynthetic performance were due to their genetic makeup or to the different environments where they were grown,” said lead researcher Dr Viridiana Silva-Perez from the ARC Centre of Excellence for Translational Photosynthesis (CoETP). Read more here.

Subscribe to USW Reports. USW publishes a variety of reports and content that are available to subscribe to, including a bi-weekly newsletter highlighting recent Wheat Letter blog posts, the weekly Price Report and the weekly Harvest Report (available May to October). Subscribe here.

Follow USW Online. Visit our page at https://www.facebook.com/uswheat for the latest updates, photos and discussions of what is going on in the world of wheat. Also, find breaking news on Twitter at www.twitter.com/uswheatassoc and video stories at https://www.youtube.com/uswheatassociates.

thumbnail

By Claire Hutchins, USW Market Analyst

Despite the potential for reduced U.S. hard red spring (HRS) production year-over-year and crop quality concerns on late-harvested HRS, the United States is still well-stocked to meet overseas customer needs throughout marketing year (MY) 2019/20. As domestic sellers and buyers manage their risk in a dynamic market, however, overseas buyers should expect HRS export basis to increase. U.S. Wheat Associates (USW) wants to provide a closer analysis of this rather unique situation.

Unrelenting precipitation in the Northern Plains continued to challenge HRS wheat producers throughout the 2019 harvest season. Excess moisture on unharvested wheat can lead to low falling numbers, reduced test weights, reduced percentage of DHV and increased DON levels. By Sept. 20, only 76 percent of the country’s spring wheat was harvested compared to 96 percent in 2018.

As markets considered potential quality issues on the rest of the harvest, HRS export prices jumped significantly between Sept. 13 and Sept. 20. The average Gulf HRS 14.0 (12% moisture basis) export basis for nearby delivery increased 20 cents/bu from $1.40/bu to $1.60/bu. In the same week, average Pacific Northwest (PNW) HRS 14.0 export basis for nearby delivery jumped 36 percent from $1.05/bu to $1.65/bu. Market uncertainty carried into the week of Sept. 27 when the country’s HRS harvest was only 87 percent complete, well behind the 5-year average of 99 percent. By Sept. 27, the average Gulf HRS 14.0 export basis increased another 30 cents to $1.90/bu and the average PNW HRS 14.0 export basis added 27 percent to $2.10/bu, both driven by crop quality concerns and minimal farmer selling.

Source: U.S. Wheat Associates Price Report, Oct. 4, 2019

In its October World Agricultural Supply and Demand Estimates (WASDE) report, USDA estimated the United States would produce 15.2 million metric tons (MMT) of HRS in 2019. On Oct. 15, USDA reported harvest was 94 percent complete, still well behind the average completion date of around Sept. 30. Many industry sources now believe the HRS harvest is essentially over as farmers struggle to enter their fields due to ongoing precipitation, including heavy snow in parts of North Dakota and Montana. If realized, this would put the total 2019 U.S. HRS harvest closer to 14.3 MMT, 12 percent lower than last year.

As noted, the United States is still well-stocked to meet export throughout MY 2019/20. Industry experts estimate between 60 and 65 percent of this year’s HRS harvest, about 8.94 MMT, is high-quality, milling grade wheat. USDA estimated 2019 HRS beginning stocks at 7.16 MMT. This puts the total supply of U.S. milling wheat in MY 2019/20, including the remainder of last year’s excellent harvest, at 16.1 MMT.

However, customers should be aware that a large portion of these stocks remain in storage as farmers are reluctant to sell wheat at current local prices. HRS export basis levels continue to climb because producers have several incentives to hold their high-quality HRS into the coming months.

First, Minneapolis Grain Exchange (MGEX) forward futures contracts show a significant carry between December 2019 and December 2020. As of the last trade on Oct. 15, the December 2019 MGEX HRS futures contract (MWEZ19) traded at $5.45/bu while the December 2020 MGEX HRS futures contract (MWEZ20) closed at $5.95/bu. Each MGEX HRS futures contract gains about 10 cents per contract period starting in December 2020, a reason for farmers to hold supplies until cash prices increase.

Source: MGEX

Second, average local basis levels are firming across the Northern Plains, which signals to farmers that the discount between futures values and the cash price they receive could shrink over time. For example, according to DTN data, the average HRS local basis value in North Dakota decreased from negative $0.79/bu to negative $0.72/bu between Sept. 30 and Oct. 15. At one elevator in North Dakota, the gap between the December futures price and the local cash price shrank 42 percent from negative $1.05/bu to $0.65/bu. Over the same period, the local average HRS cash price in North Dakota increased from $4.66/bu to $4.74/bu.

Finally, storage space is not under pressure. Typically, HRS moves into the market around harvest and when storage space is needed for row crop harvest, which in 2019 has seriously affected in the Northern Plains. For example, the heavy snow hit North Dakota with only 1 percent of the corn harvest and 16 percent of the soybean harvest completed. With no other crops coming out, farms and country elevators do not yet need to move much HRS wheat out of storage.

Given this situation, USW believes HRS export basis will continue to rise until local cash prices increase enough to encourage producers to liquidate their HRS stocks into the milling and export channels. The United States has plenty of high-quality HRS available to sell into MY 2019/20, but it will take a significant shift in local cash price dynamics across the Northern Plains for these supplies to reach export terminals.


thumbnail

By Dalton Henry, USW Vice President of Policy

While the trade policy headlines from the month of October have mostly been written about a possible “phase one” trade deal between the United States and China, much less has been said about the recently revised and published China Tariff Rate Quota (TRQ) rules for importing wheat and other agricultural products – though their impact could be nearly as significant for the affected commodities.

China’s TRQ rules were expected to be changed because of the World Trade Organization (WTO) ruling last April that found China had not complied with the terms they agreed to upon joining the WTO in 2001. TRQ’s govern the import of specified levels of products at a specific tariff rate that is lower than the global or Most Favored Nation (MFN) rate. Without TRQ, Chinese importers cannot profitably access the world market for wheat, as China’s MFN tariff is 65%. Restricted fill rates on TRQ over the past decades have proven to be the biggest constraint to growing market share for imported wheat in China. Today, imported wheat rarely exceeds 5% of mill use.

Upon accession to the WTO, China established a 9.64 million metric ton (MMT) TRQ for wheat, but that annual TRQ has never fully filled, despite world wheat prices and market conditions conducive to doing just that. When the United States filed the case at the WTO in 2016, they alleged that China had used a series of policies in administering the TRQ that were not “transparent, predictable or fair” and by doing so they, “…limited opportunities for U.S. farmers to export competitively priced, high-quality grains to customers in China.”

That limitation has had effects beyond the impacts on U.S. farmers though, as it also severely limits Chinese millers’ access to high quality wheat grown outside of China. In especially short supply in the domestic market are both soft wheats – often used for pastries and cakes as well at higher protein spring wheats, which are necessary for pizza crusts and hamburger buns.

When the United States won the WTO case, China agreed not to appeal and that they would come into compliance with the ruling by December 2019. That put the case on a relatively fast track to be completed, spanning just under three years since it was filed, much to the joy of U.S. wheat farmers who had long pushed for U.S. government action to force change in the TRQ administration.

U.S. Wheat Associates (USW) has been reviewing the new measures along with the U.S. government and Chinese flour millers. USW Regional Vice President for China and Taiwan, Jeff Coey, has found several of the new rules promising, especially the announcement’s stated goal for both the state and non-state portions of the TRQ to be fully utilized so long as market conditions allow it. Full utilization of both segments of the TRQ hasn’t previously been stated as a goal, leading to significant optimism about access to wheat supplies in 2020. Other positive changes include the allowance for more state-owned entities to apply for TRQ allocations and for non-state-owned entities to apply for the portion of the TRQ that was previously reserved for the state – essentially giving both groups the potential ability to import for the first time.

The TRQ changes and the need for quality wheat supplies may make China a significant wheat importer in 2020. If the changes are in fact implemented, and Chinese millers can respond to market signals, most of the 9.36 MMT TRQ should be used. The net result of that would be China becoming a top world wheat importer, even as they have adequate domestic wheat stocks on hand. From a quality supplier point of view, this opens many opportunities for the United States to provide technical expertise and assistance to our Chinese customers. While allowing those customers access to lower costs and wheat with specialized end-use applications that distinguishes U.S. wheat from domestic supplies.

As with so many issues in trade policy, only time will tell how effective these announced changes will be in allowing Chinese millers to source imported wheat. Both the U.S. government and U.S. Wheat Associates will be closely monitoring the changes to ensure compliance with the WTO ruling, but for now 2020 looks likely to start off on a better foot for U.S. producers and their Chinese customers.


thumbnail

Pacific Northwest (PNW) farmers produced another fine soft white wheat (SW) and white club (WC) crop with good test weight and very acceptable finished product characteristics for 2019. Adequate soil moisture at planting and throughout the growing season did contribute to higher moisture and protein content compared to 2018 but protein remained lower than the 5-year average. In fact, the higher SW protein segment provides opportunities in blends for crackers, Asian noodles, steamed breads, flat breads, and pan breads. Variations in performance data for 2019 compared to 2018 and the 5-year averages are included below for this 6.09 million metric ton (MMT) crop, including 170,000 MT of WC.

That is a summary of results from the U.S. Wheat Associates (USW) 2019 SW and WC crop quality analysis to be posted soon at https://www.uswheat.org/market-and-crop-information/crop-quality/. To complete the analysis, the Wheat Marketing Center (WMC) received and tested SW and WC samples from Idaho, Oregon, and Washington. The Federal Grain Inspection Service (FGIS) graded and ran wheat protein on each sample. WMC conducted wheat, flour, Solvent Retention Capacity (SRC), dough, and finished product tests on composites based on production zones and protein levels. Funding for the annual survey come from state wheat commission USW members and the USDA Foreign Agricultural Service.

As always, buyers are encouraged to review their quality specifications to ensure that their purchases meet their expectations.

Wheat and Grade Data: The Overall average grade of the 2019 SW and WC crops is U.S. No. 1. The average SW test weight of 61.6 lb/bu (81.0 kg/hl) is slightly lower than last year’s 61.7 lb/bu (81.1 kg/hl); WC test weight of 60.6 lb/bu (79.7 kg/hl) is slightly higher than 2018’s 60.4 lb/bu (79.5 kg/hl). SW has fewer damaged kernels, fewer shrunken and broken kernels, and less foreign material than the 5-year averages. WC shrunken and broken kernel percentages are lower than last year and the 5-year averages. WC foreign material is higher than last year and 5-year averages. WC dockage is slightly higher than last year and the 5-year averages. Other WC grade factors are similar to past averages. Wheat moisture for both SW and WC is above last year and the 5-year averages.

The Overall SW and WC wheat protein content (12% mb) of 10.0 and 9.8%, respectively, are 0.7 and 0.8 percentage points above the respective 2018 values, but below those of 5-year averages. SW and WC wheat ash contents (14% moisture basis) are similar to last year and the 5-year averages. Thousand kernel weight for SW is above 2018 and the 5-year average levels; WC is lower than last year and higher than the 5-year average. SW kernel diameter is the same as last year, but larger than the 5-year average. WC kernel diameter is smaller than last year, but larger than the 5-year average. Falling number values are 317 sec for SW and 355 sec for WC.

Flour, Dough, and Bake Data: The 2019 Buhler Laboratory Mill flour extraction average for SW and WC at 72.1% and 72.8% respectively are lower than last year and the 5-year averages. Flour protein content (14% mb) is 8.9% for both SW and WC. Flour ash content (14% mb) for both SW and WC are higher than last year but the same as 5-year averages. Amylograph peak viscosity value for SW is 485 BU, slightly lower than last year; WC is 523 BU, much higher than last year. Starch damage value is slightly higher for SW than last year but lower than the 5-year averages. WC starch damage is lower than last year and the 5-year averages.

Solvent retention capacity (SRC) water values for SW and WC are less than last year and 5-year averages. SW lactic acid and sodium carbonate values are similar to last year and the 5-year averages. WC lactic acid values are higher than last year, but same as 5-year average. SW and WC gluten performance index (GPI) values are similar to last year and 5-year averages. SW farinograph peak and stability times are shorter than last year and the 5-year averages. WC peak time is slightly longer than last year and 5-year averages. SW and WC water absorptions are similar to last year, but less than the 5-year averages. The SW and WC alveograph L values are considerably longer than last year and 5-year averages. SW and WC extensograph resistance is larger than last year and the 5-year averages. SW and WC extensibility values are longer than last year and the 5-year averages.

Sponge cake volume for SW at 1104 cc is larger than last year, but smaller than the 5-year average, and the total score is slightly lower than last year and the 5-year averages. The sponge cake volume for WC at 1141 cc is slightly larger than last year, but smaller than the 5-year average, and total score the same as last year and much higher than the 5-year averages. SW and WC cookie diameter values are smaller than last year, but similar to the 5-year averages. SW and WC cookie spread factors are more than last year and the 5-year averages.

Chinese Southern-Type Steamed Bread: In southern-type steamed bread compared to a control flour, the 2019 SW and WC specific volumes are slightly less than last year and the 5-year averages. The SW total score is higher than last year and the 5-year averages; WC is the same as last year, but lower than the 5-year average.