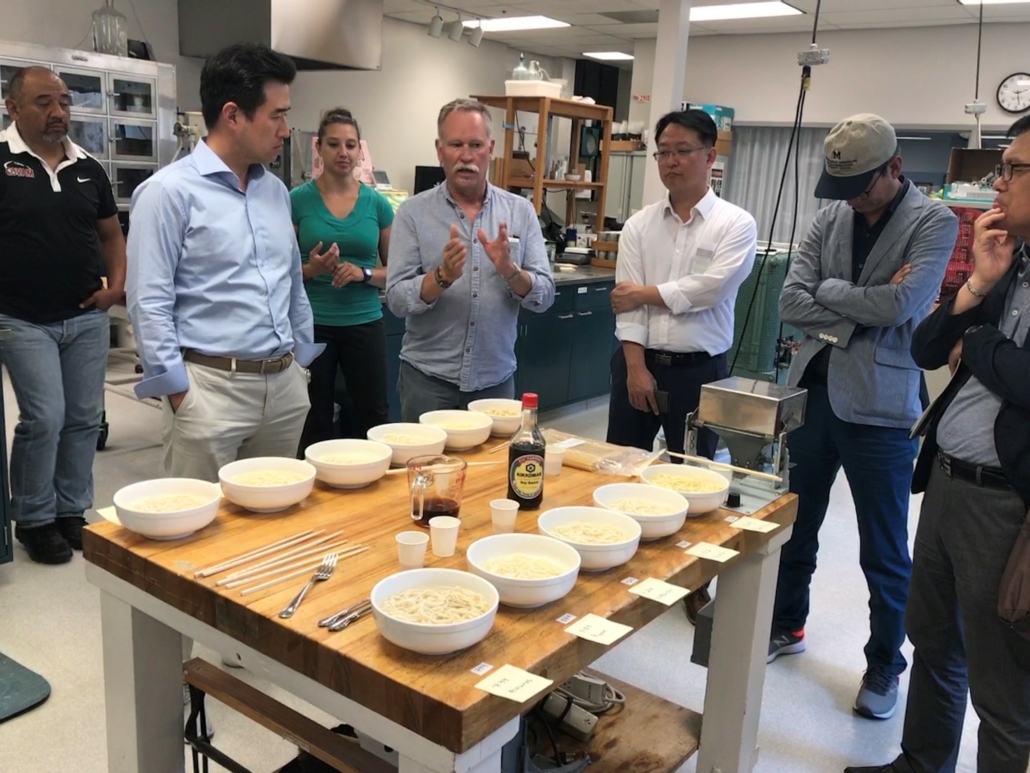
2021 hard white (HW) wheat samples show good quality performance in milling, dough properties and finished products, including pan breads, Asian noodles and steamed breads. The Pacific Northwest (PNW), California and Southern Plains composites all show good bread baking potential according to their respective protein contents. For Asian noodle applications, 60% extraction patent flour is recommended to improve noodle color while maintaining noodle texture. For steamed breads, it is recommended that high protein HW flour be blended with a portion of soft white (SW) flour to improve product quality.
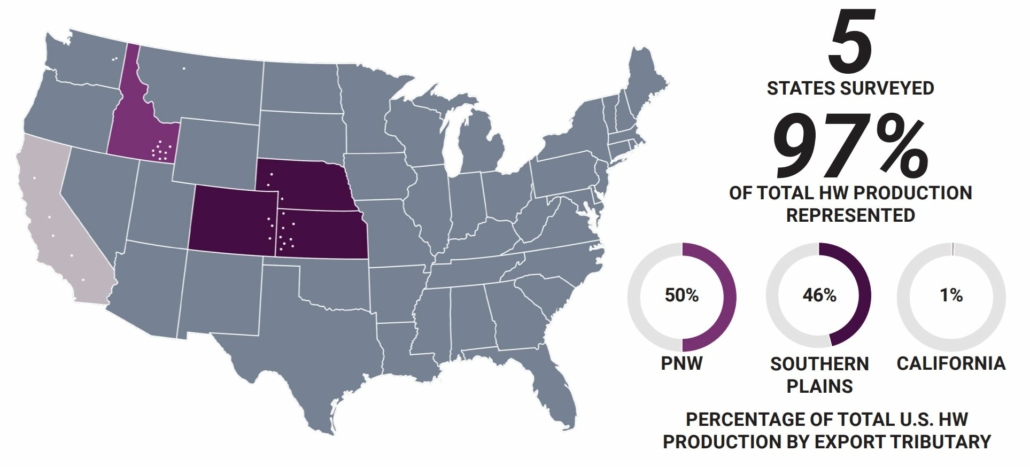
Production of the 2021 hard white crop is 0.71 MMT, up 13% over last year. Much of the increase is due to additional seeded acres and good production in Kansas, Colorado and Nebraska. Spring seeded HW was down due to the drought, which trimmed yields in southern Idaho.
2021 Crop Highlights
- Grade average for six of the eight composites is U.S. No. 1. The low- and med-protein Southern Plains composites graded U.S. No. 2 due primarily to low test weights.
- Test Weight ranged from 58.4 to 63.2 lb/bu (76.9 to 83.1 kg/hl).
- Wheat Moisture ranged from 8.9 to 11.7%
- Wheat Protein ranged from 11.0 to 13.7% (12% mb).
- 1000 Kernel Weight for the Southern Plains low- and California high-protein composites are 20.1 and 28.6 g, respectively. All others are greater than or equal to 30.0 g.
- Kernel Characteristics include kernel hardness averages 42.5 to 84.2 and kernel diameters 2.46 to 2.71 mm.
- Falling Number averages 349 sec or higher for all composites.
- Laboratory Mill straight-grade flour extractions range 69.8 to 73.1%, L* values (whiteness) 91.2 to 92.1, flour protein 10.0 to 13.0% (14% mb) and flour ash 0.45 to 0.53% (14% mb).
- Wet Gluten contents range 25.1 to 29.8% depending on flour protein content.
- Amylograph peak viscosities are between 553 and 1051 BU for all composites.
- Farinograph absorptions range 52.4 to 62.9% and stability times 7.3 to 35.1 min, exhibiting medium to strong dough characteristics. HW farinograph absorption indicates more tolerance to overmixing.
- Extensograph at a 135 min rest shows maximum resistance in the range of 294 to 1203 BU, extensibility 6.2 to 18.4 cm and area 58 to 183 cm2. The Southern Plains low- and med-protein composites were 294 and 528 BU, respectively, and all other composites were greater than or equal to 885 BU.
- Alveograph ranges are P (38 to 120 mm); L (83 to 137 mm); and W (107 to 393 (10-4 J)).
- Damaged Starch values are in the range of 3.9 to 5.6%.
- Lactic acid SRC values range from 86 to 153%, indicating weak to strong gluten strength. The range shrinks to 116 – 153% if the Southern Plains low-protein composite is removed from the set.
- Bake Evaluation for all composites shows acceptable to good baking performance relative to protein content, with bake absorptions in the range of 57.6 to 67.8%, loaf volumes of 742 to 950 cc, and crumb grain and texture scores of 6.0 to 8.0 points.
- Chinese Raw Noodles (white salted) L* values at 0 hr of production and after 24 hr of storage at room temperature are acceptable for the Southern Plains low- and med-protein composites. The sensory color stability scores for PNW and Southern Plains low- and med-protein composites are similar to or better than the control noodle of 7.0. Cooked noodle texture is softer for the California med-protein composite.
- Chinese Wet Noodles (yellow alkaline) sensory color stability scores are slightly to moderately worse than the control for parboiled noodles from all composites. The cooked noodle texture is similar for all composites. Overall, this year’s HW samples will produce noodles with acceptable color and texture if low ash patent flour is used.
- Steamed Bread results show higher protein composites have larger specific volumes with total scores equivalent to the control flour. Blending 25% SW flour with high protein HW flour may improve overall steamed bread quality.
Buyers are encouraged to review their quality specifications to ensure that their purchases meet their expectations.
U.S. Wheat Associates (USW) has posted more about the 2021 hard white crop here.
2021 Crop Quality Data on Other U.S. Wheat Classes
Hard Red Winter
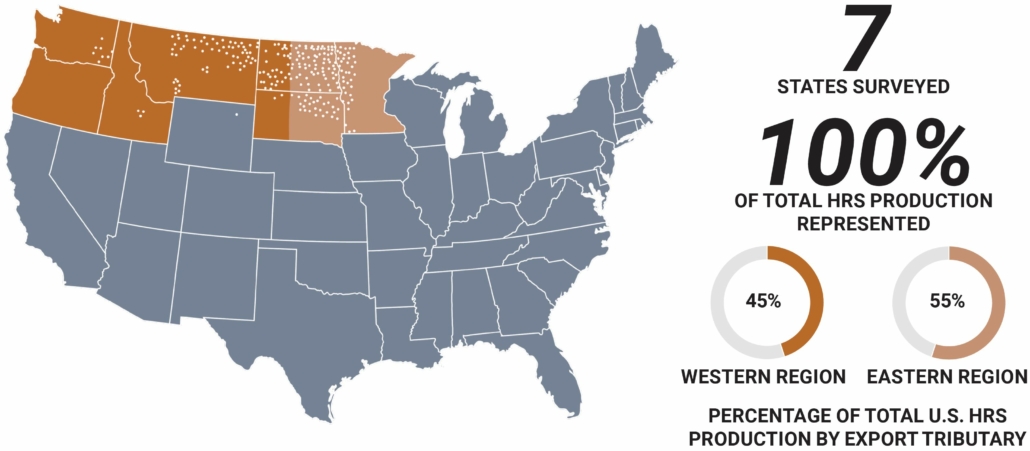
Hard Red Spring
Soft Red Winter
Soft White
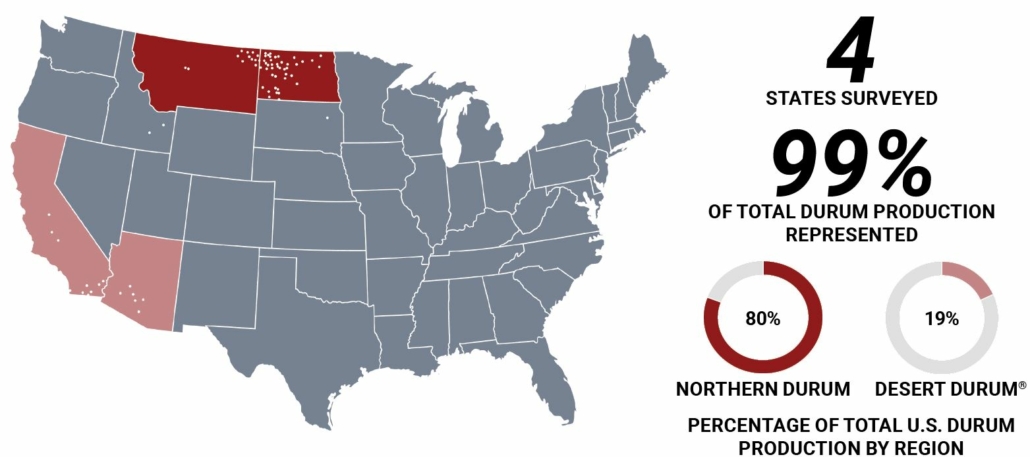
Northern Durum
Desert Durum® And California Hard Red Winter