Recent news and highlights from around the U.S. wheat industry.
Speaking of Wheat. “The market is panicking but rightly so. Balance sheets globally were relying on a big Aussie milling wheat crop to cover until new crop Northern Hemisphere [arrived]. I guess the rally in Aussie prices is overdone but prices won’t go back down to where they were a month ago until maybe the end of Q1 and assuming Northern Hemisphere crops are all looking good.” – An Australian wheat trader quoted in a Nov. 23 “AgriCensus” article titled “Australia’s WA Wheat Market Explodes as Protein Levels Disappoint.”
Condolences to our colleague Chang Yoon (CY) Kang, Country Director, USW/Seoul, and his family on the recent passing of his mother.
Congratulations to our colleague Dalton Henry, USW Vice President of Policy, and his wife Sarah on their new baby boy, Samuel Walter Henry, born Nov. 18, 2021.
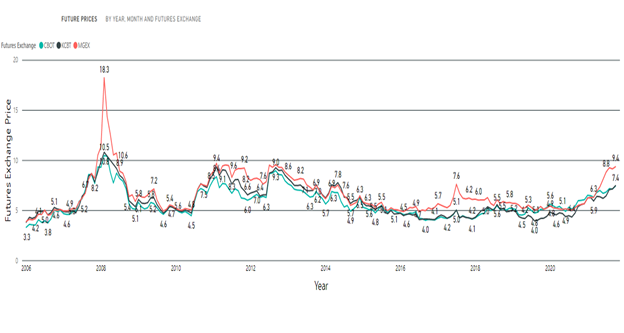
A “Dizzying” Market. Reuters reported this week that “benchmark wheat traded in Chicago climbed to a nine-year peak late last month, while prices at ports in Russia, the world’s No. 1 supplier, and Australia, typically the fourth largest exporter, are at all-time highs. World food prices rose for a third straight month in October to reach a new 10-year peak, led by increases in cereals and vegetable oils, the UN food agency said. The dizzying price levels are alarming buyers who are still suffering from the economic impact of the coronavirus pandemic, with decade-high freight costs compounding their problem.”
“Hell in a Handbasket.” That is the title Rabobank chose for its November Agri Commodity Markets Research Outlook for 2022. “It is highly unlikely that food prices will go back to the five- or two-year averages in 2021 as commodity prices are now supported by inflation … high shipping costs, energy and fertilizer prices, as well as a shortage of labor in many countries,” the report stated. Rabobank predicts wheat prices will stabilize in the second half of 2022 assuming reduced demand for feed wheat.
Goyings Farms Top Ohio’s SRW Wheat Yield Contest. Congratulations to USW Past Chairman Doug Goyings and his son Jeremy, Paulding, Ohio, who produced the top yield in the state’s 2021 Wheat Yield Contest with an entry of 138.4 bushels. An “Ohio Country Journal” article described their intensive management of their soft red winter (SRW) wheat crop, to the use of fungicides and insecticides to protect the crop in the late spring and early summer. Read more.
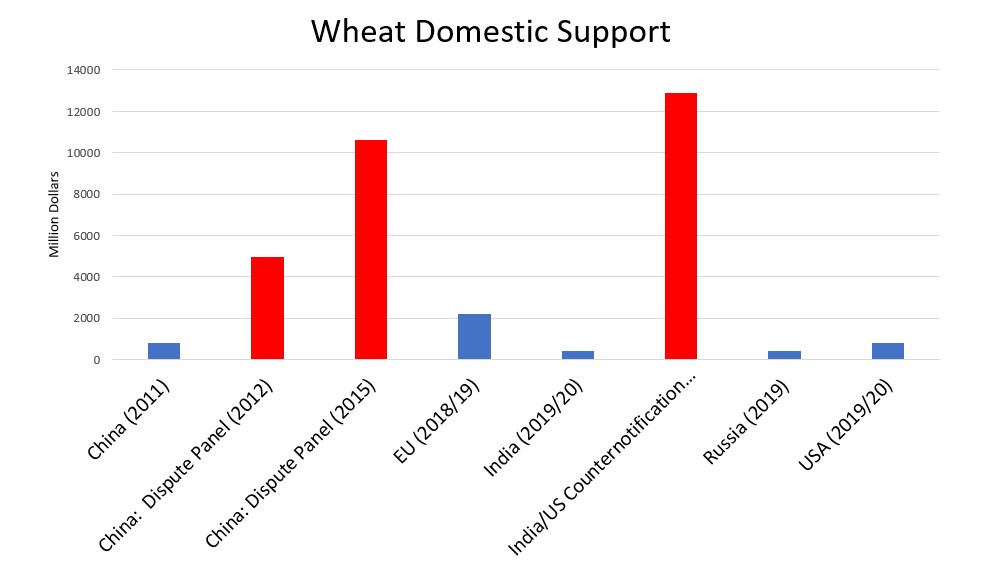
Indian Government Spreads More Subsidy Joy to Farmers. Reuters reported Dec.1 that Indian fertilizer stocks jumped after a report the government plans to increase fertilizer subsidies to a record … in 2021-2022 to avoid shortages amid a sharp rise in global prices. India, the top urea importer, has already raised fertilizer subsidies twice in this fiscal year ending March 31, and the new figure is almost double the amount initially budgeted. Studies have shown that India’s massive production subsidies distort trade, causing annual losses of more than $500 million for U.S. wheat farmers.
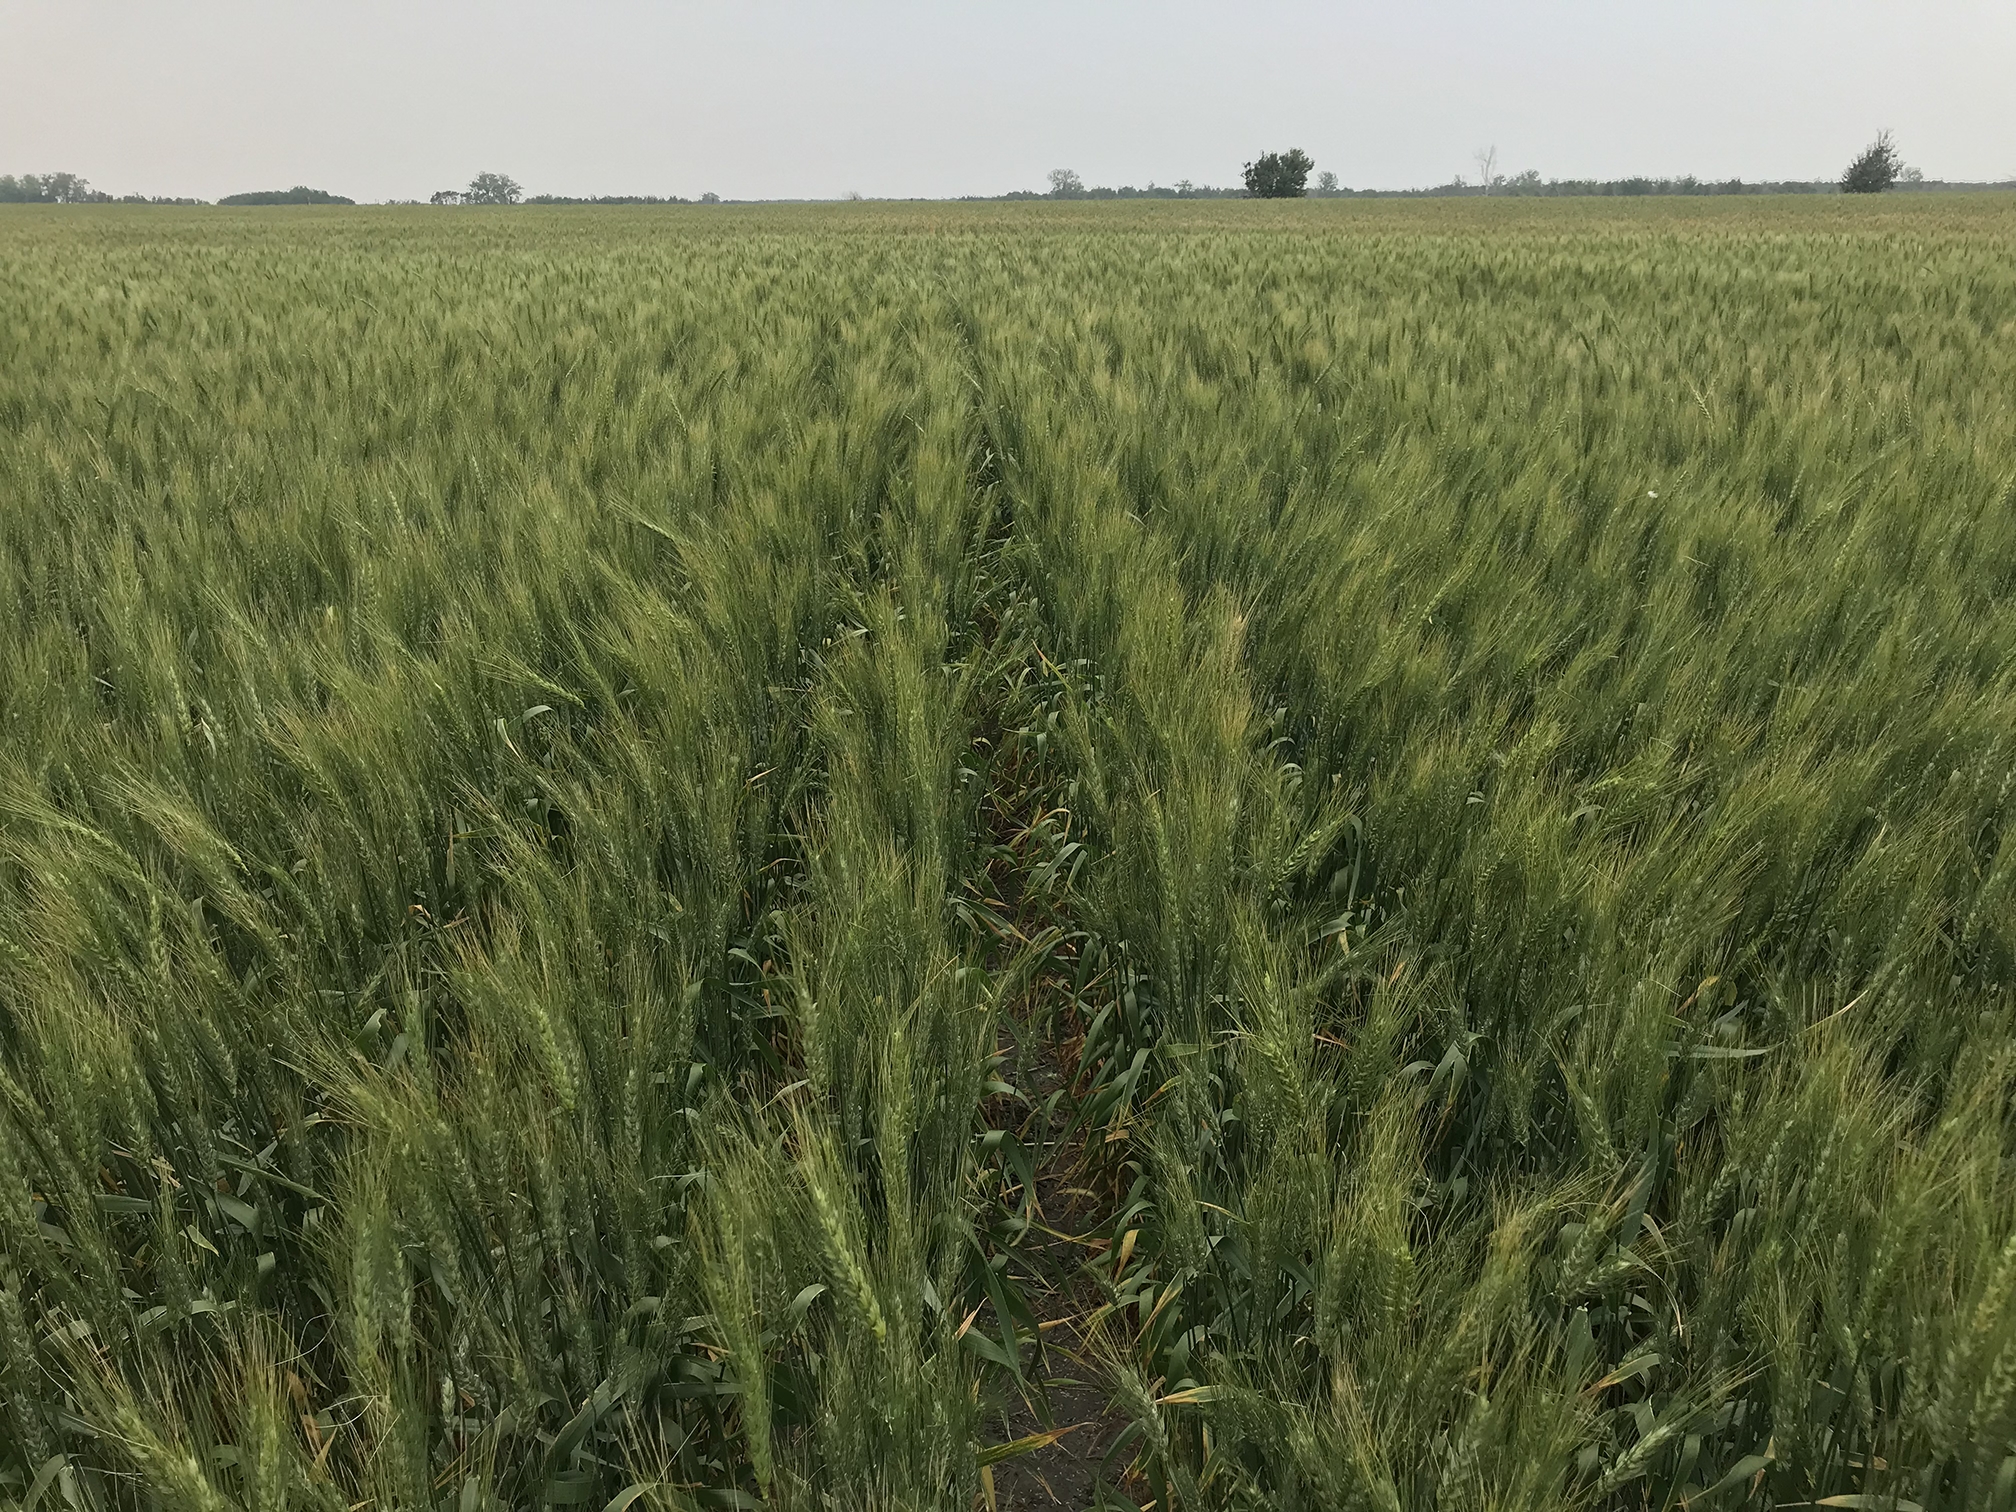
2022/23 Winter Wheat Conditions. USDA/National Agricultural Statistics Service reported Nov. 30 that nationwide, 92 percent of the winter wheat acreage had emerged by Nov. 28, equal to last year but 1 percentage point ahead of the 5-year average. As of Nov. 28, forty-four percent of the 2022 winter wheat acreage was reported in good to excellent condition, unchanged from the previous week but 2 percentage points below the same time last year.
Cereal & Grain Sciences Events Calendar. Dr. M. Hikmet Boyacioglu, an Applications Development Specialist with KPM Analytics, updates a calendar of cereal and grain sciences industry events every month. Contact Dr. Boyacioglu to receive the calendar link each month via email.
Subscribe to USW Reports. USW publishes various reports and content that are available to subscribe to, including a bi-weekly newsletter highlighting recent Wheat Letter blog posts and wheat industry news, the weekly Price Report and the weekly Harvest Report (available May to October). Subscribe here.
Follow USW Online. Visit our Facebook page for the latest updates, photos and discussions of what is going on in the world of wheat. Also, find breaking news on Twitter, video stories on Vimeo and more on LinkedIn.


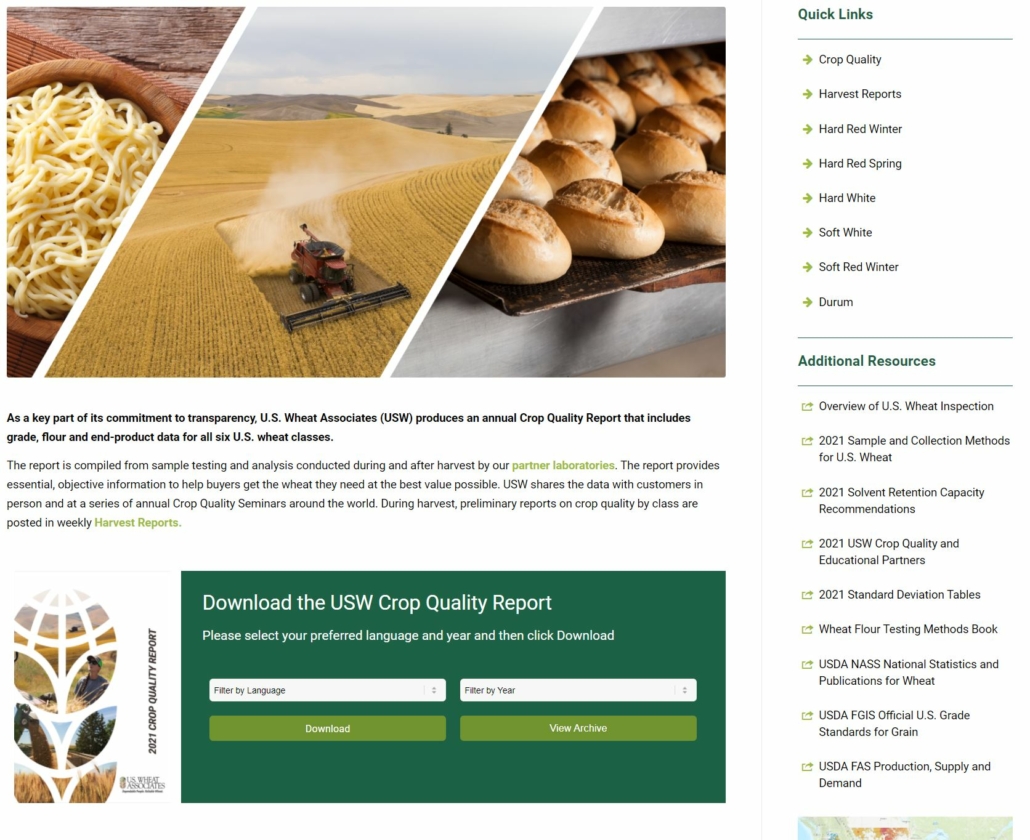


 The 2021 USW Crop Quality Report is now available for download in