U.S. Wheat Associates (USW) sees a robust growth opportunity for U.S. wheat exports to South America. To meet rising demand for bread, snacks and other wheat foods, regional flour millers are hungry for information they need to purchase a wider range of high-quality wheat classes.
U.S. wheat must compete in Colombia, Peru, Chile, Brazil and other South American countries with imported Canadian and Argentinian wheat. Technical training and comparative analysis to demonstrate the advantages of U.S. wheat classes are important parts of USW’s work in the region. However, those efforts are somewhat constrained because a substantial portion of the funding for activities was needed for travel costs to conduct activities in sometimes limited facilities in each country or at U.S. educational institutions.
ATP Funding Yields Innovative Idea
A potential answer to this challenge arrived in 2019 when the Agricultural Trade Promotion (ATP) program, administered by USDA’s Foreign Agricultural Service (FAS), was created to help U.S. agriculture build new export markets. Under ATP, USW’s regional South American office staff in Santiago, Chile, proposed an innovative promotional concept to establish a regional flour milling, cereal chemistry and baking laboratory in cooperation with a respected university.
Through pandemic-related delays and customs challenges, USW and its project partner, Universidad Mayor, worked steadily to build a facility on the university’s Santiago campus and equip the lab with a test flour mill, wheat and flour analysis instruments and bread ovens. On Dec. 3, 2021, USW and the university dedicated Laboratorio De Analisis De Granos Harinas Y Panifcacion at an event attended by Chile’s Minister of Agriculture, U.S. State Department and FAS officials, the university rector and executives with several Chilean flour mills.
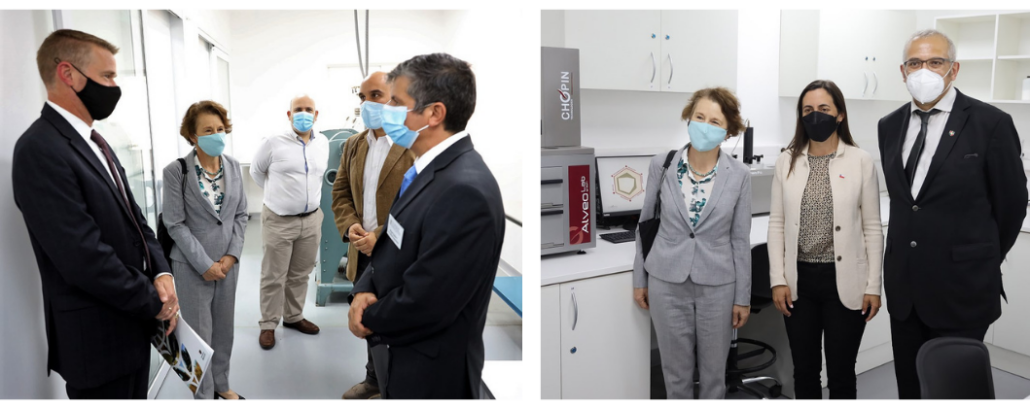
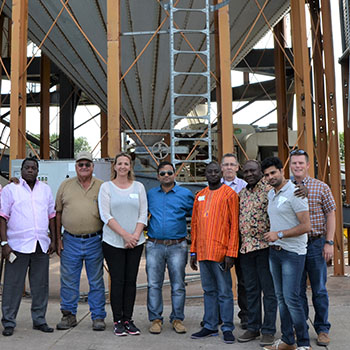
Honored Guests. Learning more about the new lab are, (L to R): Bret Tate, Agricultural Attaché, USDA/FAS; Lisa Swenarski, Counselor for Public Affairs, U.S. State Department; Pedro Pablo Lagos, Purchasing Manager, Luchetti Pasta, Santiago, Chile; Andrés Saturno, Technical Manager, USW/Santiago; Miguel Galdós, Regional Director, USW/Santiago; Lisa Swenarski; María Emilia Undurraga, Chilean Minister of Agriculture; Dr. Patricio Manque, Rector, Universidad Mayor. Photos courtesy of Universidad Mayor.
“We are very pleased to open the first lab of its kind in this region with Universidad Mayor,” said Miguel Galdós, USW Regional Director, South America. “We know that technical managers at South American flour mills have more influence today on the types of wheat their mills need to purchase. USW will be able to help more of those managers understand the differential advantages of U.S. wheat classes by conducting programs at this regional lab. At the same time, having access to consistent and reliable testing and analysis will lead to improvements in production processes and help improve the quality of regional wheat-based end products.”
More Efficient, More Effective
“Before now, South American millers would have to send wheat samples to a commercial company in Guatemala for analysis, so this lab adds much more efficiency in its support for regional customers,” said Mark Fowler, USW Vice President of Global Technical Services, who participated in the dedication event.
As a partner in the new lab, USW purchased and installed all the equipment using ATP funds, while Universidad Mayor built the lab and will cover fixed costs. USW Santiago in return will share equal access with the university to the lab for technical support activities supporting U.S. wheat exports to South America and remain the lab’s only private partner for 15 years.
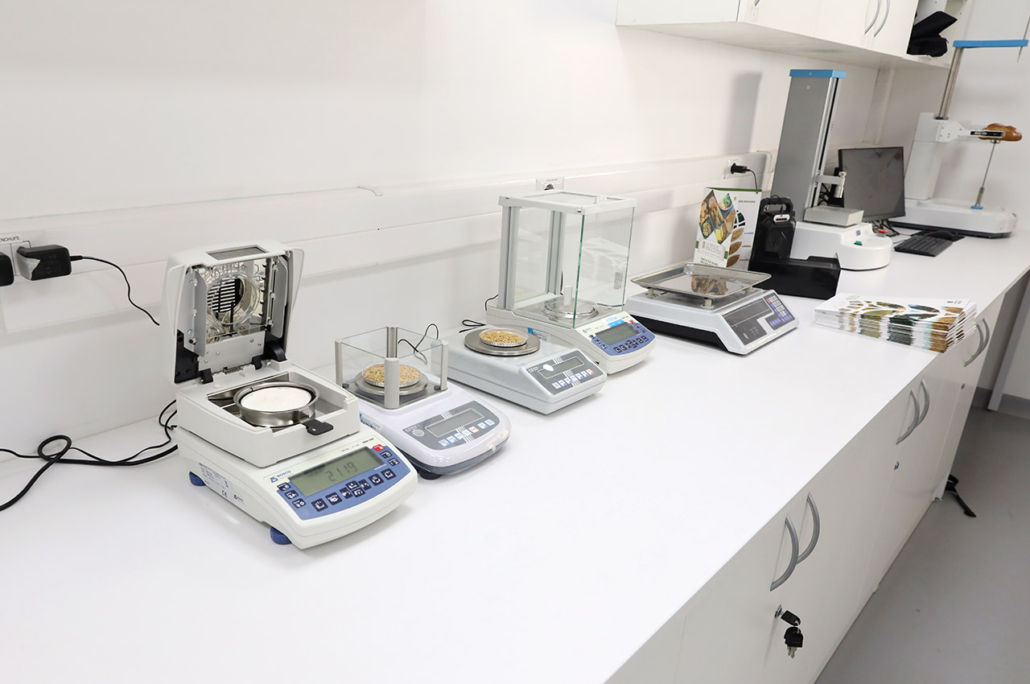
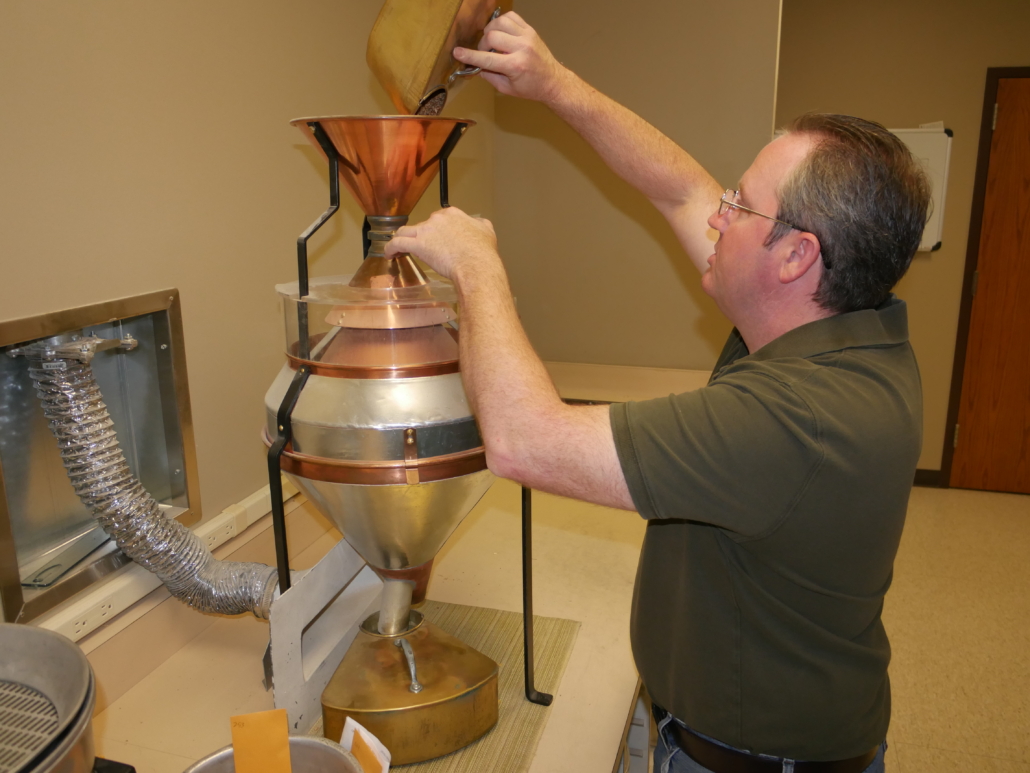
Fully Equipped. USW donated the instruments needed to analyze and compare wheat, flour and baking performance at the new lab. Funding for the equipment came from the Agricultural Trade Promotion program administered by USDA/Foreign Agricultural Service. Photo courtesy of Universidad Mayor.
Golden Opportunity
After attending the dedication event, USW Vice President of Overseas Operations Mike Spier called the new lab “a golden opportunity” to demonstrate the competitive baking advantage of U.S. wheat classes compared to wheat from other origins.
“With the ever-changing travel restrictions and quarantines, USW hasn’t been able to organize in-person technical activities for several months,” Spier said. “The lab provides everything USW Technical Specialist Andrés Saturno needs to get back to demonstrating the superior end-use baking performance of U.S. wheat classes to partners in Chile and other customers in USW’s South America region.”
Impressive Team and Project
For USW Chairman Darren Padget, a wheat farmer from Grass Valley, Ore., the dedication event was his first overseas trip to meet with customers in more than two years and his first visit to South America.
“I was very impressed by the enthusiasm of the regional USW team and among the guests at the dedication for this new lab,” Padget said. “I understand why, partly because we visited a supermarket in Santiago and saw the types of bread consumers purchase and how they shop. In Chile, consumption is very high, and they buy most of their bread for the day by the piece. Consumers there and across South America are looking for excellent quality products with a ‘clean label’ – very few additives. I think this lab will help USW demonstrate how flour from our wheat helps millers and bakers meet that demand.”
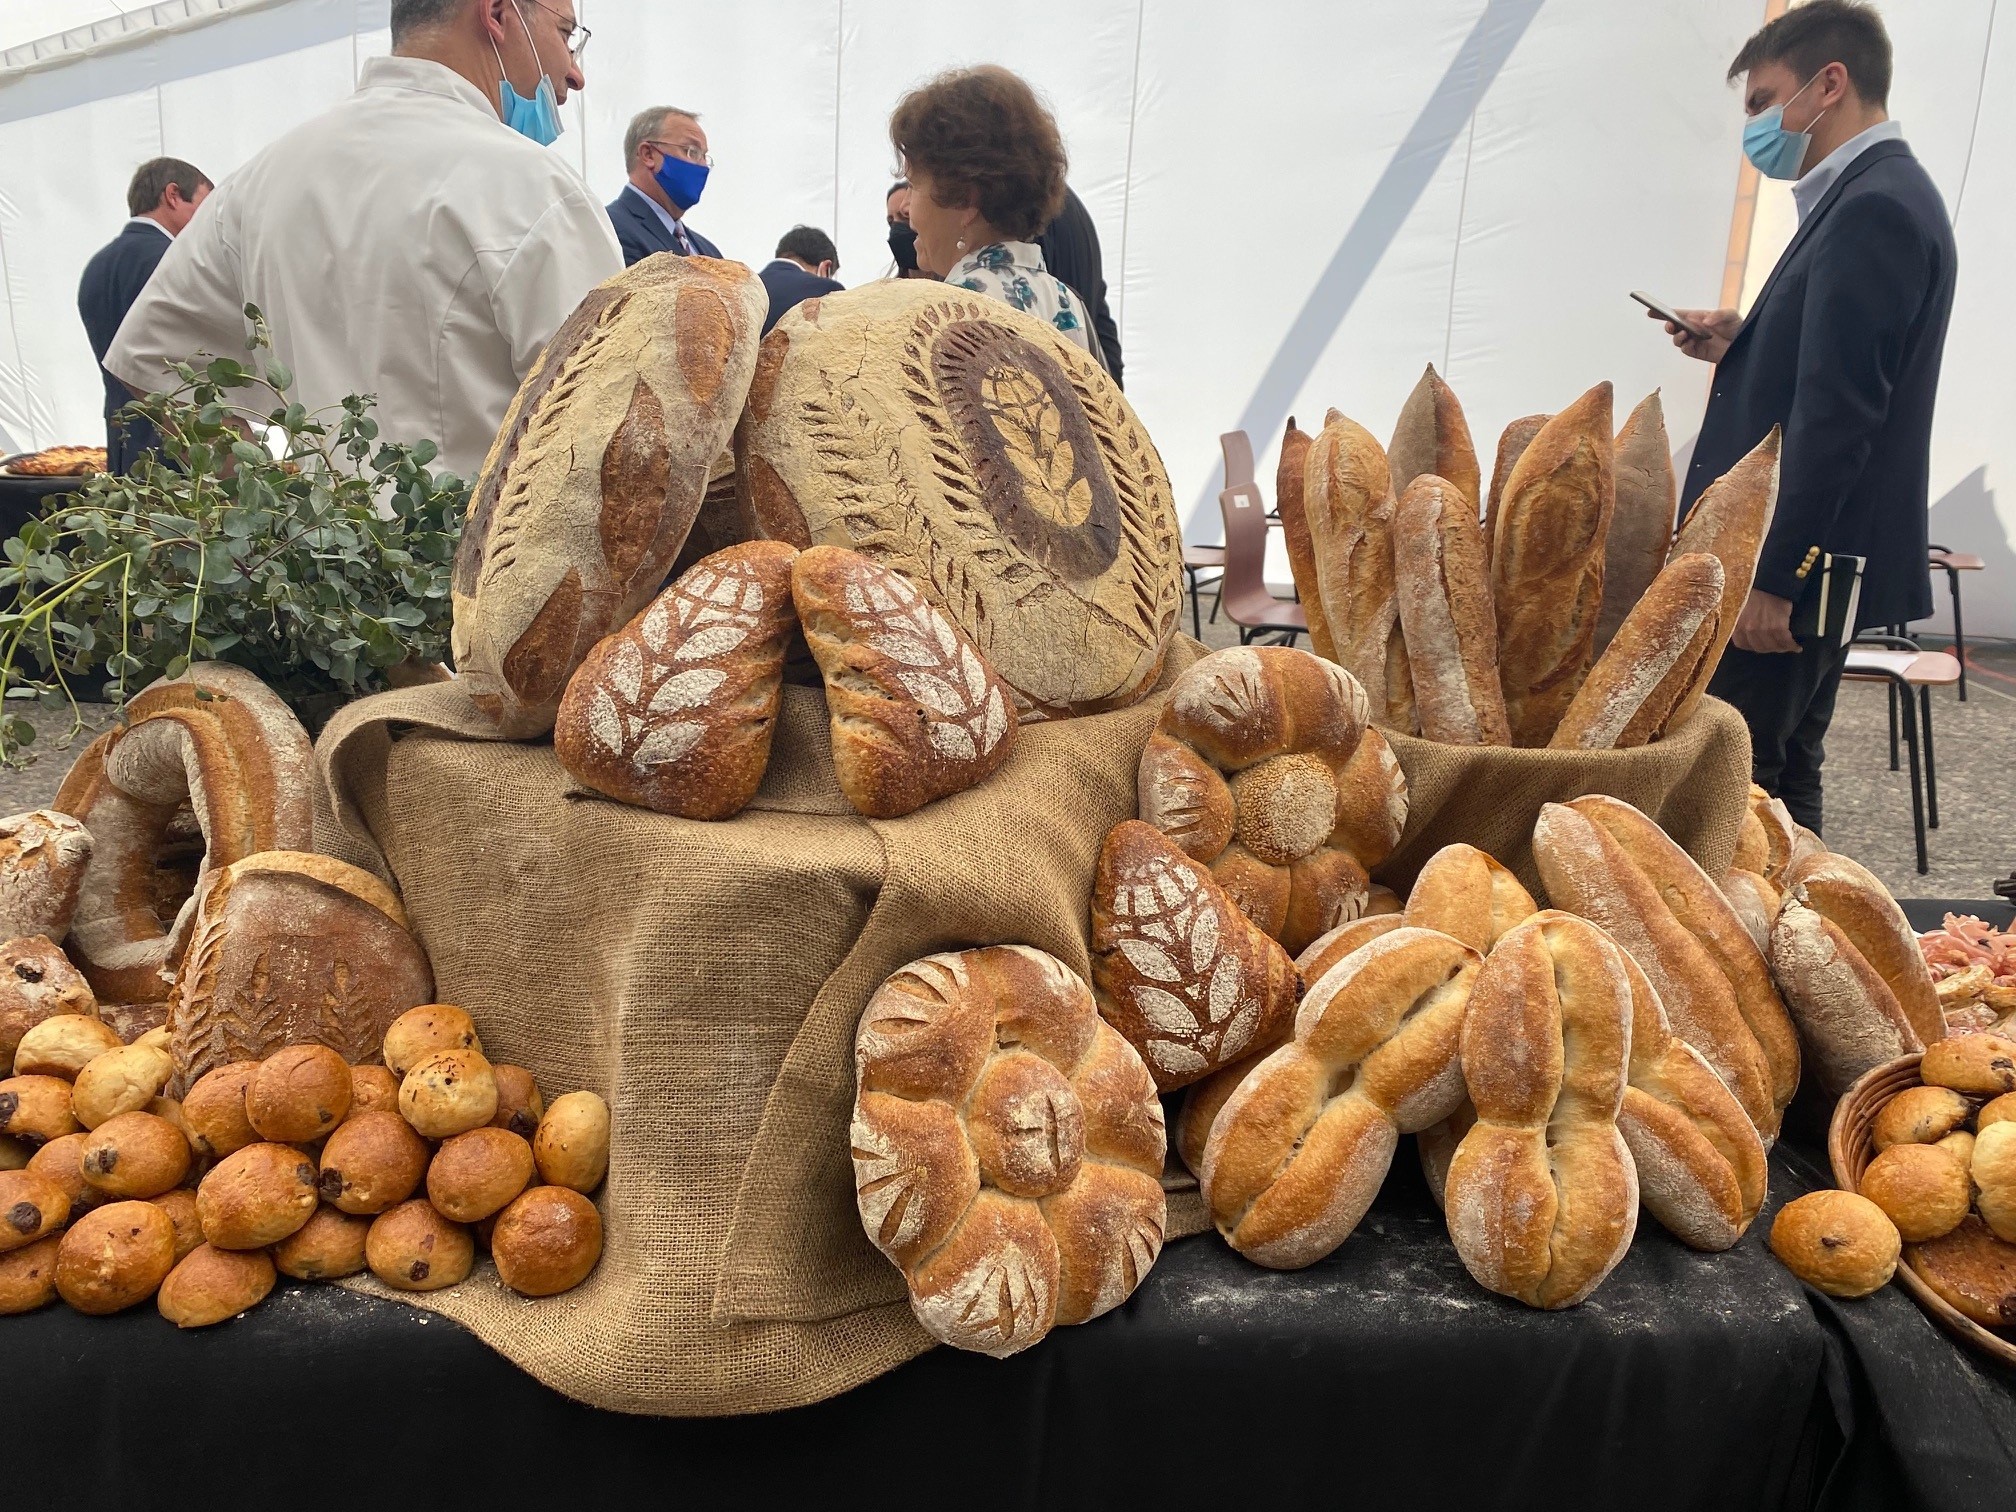
The evidence of that was on display at the dedication event as artfully crafted bread products and pizza refreshments baked by Master Baker Didier Rosada and his wife Kathy Cruz using flour milled from U.S. wheat. USW frequently works with Rosada’s Red Brick Consulting company to conduct baking seminars in Spanish-speaking countries. The week of the dedication, Rosada and USW held a workshop using U.S. wheat flour for customers representing 75% of Chile’s milling industry.

An Artful Display. Master Baker Didier Rosada and Katherine Cruz, Red Brick Consulting, produced this impressive display of bread products admired by and shared with guests at the dedication of the new lab, Dec. 3, in Santiago, Chile. Photo courtesy of Universidad Mayor.
Traditional preferences and the landed price of imported wheat will remain a competitive challenge for U.S. wheat in South America. But the complete value of U.S. wheat becomes more obvious to customers through demonstration and training. Now there is a dedicated facility for that work, giving USW the opportunity to interact with regional customers more frequently and invest more of its funding to show them the unique advantages of U.S. wheat.
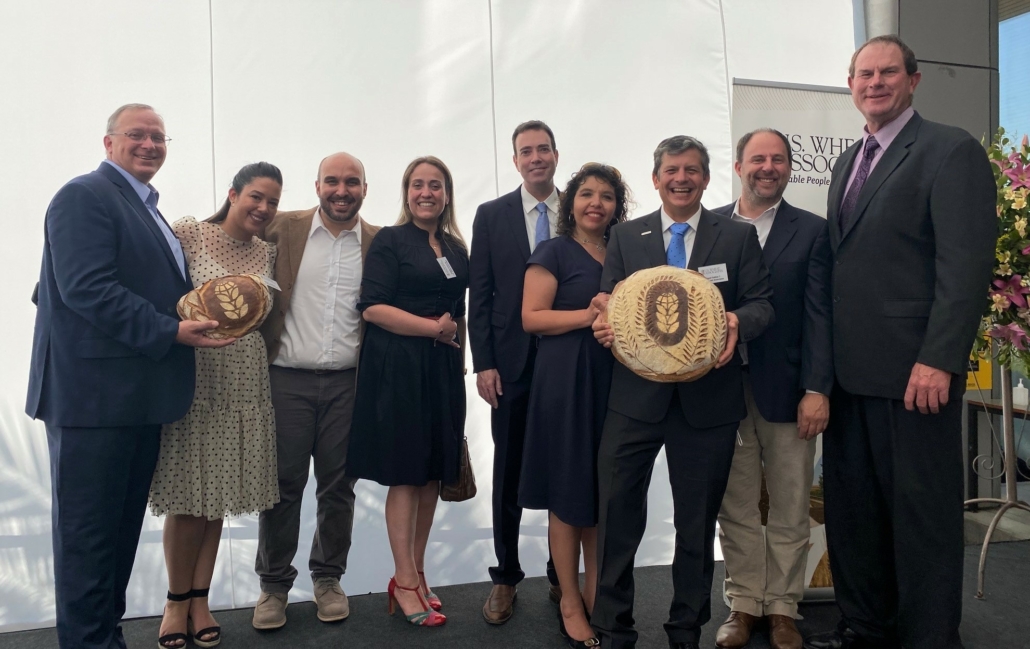
Proud Colleagues. The USW/Santiago team who worked tirelessly to build the new laboratory to promote U.S. wheat exports to South America shared their enthusiasm for the project with USW guests. L to R: Mark Fowler, Vice President of Global Technical Services; Maria Martinez, Administrative Assistant; Andres Saturno, Claudia Gomez, Senior Marketing Specialist; Mike Spier, Vice President of Overseas Operations; Paola Valdivia, Finance & Administrative Manager; Miguel Galdos; Osvaldo Seco, Assistant Regional Director; and Darren Padget, USW Chairman.