Here in the United States, the topic of sustainable agriculture is getting a lot of attention. Almost as much as what will happen between Russia and Ukraine. U.S. Wheat Associates (USW) believes people everywhere want to know where their food comes from and how it is produced. The following facts and resources will help the world’s wheat buyers learn more about sustainable wheat production in the United States.
Field to Market
Field to Market is an alliance of diverse member organizations formed to help “unite the supply chain to deliver sustainable outcomes for agriculture.” In December 2021, the National Association of Wheat Growers (NAWG) shared about sustainable wheat production from Field to Market’s latest “National Indicators Report.” That report provides an assessment of “where U.S. agriculture has made progress in driving improved environmental outcomes.”
NAWG noted the report shows wheat production saw improvement in its sustainability efforts in almost every category of land use, soil conservation, water and energy use. Review the Wheat section of the Field to Market report online here and the entire report here.
Farm Bureau
The American Farm Bureau Federation (AFBF) is a nationwide advocacy organization for U.S. farmers, including many wheat farmers and livestock producers. The organization has an interesting resource on “Sustainability in Agriculture.” AFBF co-founded the Food and Agriculture Climate Alliance and, to showcase the progress U.S. producers have made in achieving sustainability goals, also co-founded Farmers for a Sustainable Future.
This week, AFBF’s President Zippy Duvall wrote an important column pointing out some key facts about U.S. agriculture that may not be well-known. For example, he noted that “American agriculture makes up just 10% of greenhouse gas emissions, much lower than transportation, electricity generation and industry.” In addition, he said more than half the U.S. wheat corn, cotton and soybeans were planted using no-till or low-till methods (see chart below).

U.S. Sustainability Alliance
To help tell the story of sustainable wheat production to the world, USW is a member of the U.S. Sustainability Alliance. That is a group of American farmers, fishery managers and foresters who want to tell the world “how we grow.” The group offers many resources for learning more about responsible food production, including a Sustainability Podcast that will feature sustainable wheat production in a future episode.
A beneficial fact sheet titled “U.S. Wheat – A Global Leader in Sustainability” is also available from U.S. Sustainability Alliance and on the USW website.
USDA
The U.S. Department of Agriculture has important programs that benefit U.S. farmers and the environment. One example is the Conservation Reserve Program, which has a direct, positive impact on carbon sequestration. There are 140 million acres (56.7 million hectares) of privately owned land reserved from cultivation. In other words, that amount of land is more than the states of New York and California combined.
On Feb. 7, USDA Secretary Tom Vilsack announced “Partnerships for Climate-Smart Commodities” to support America’s climate-smart farmers, ranchers, and forest landowners. The $1 billion investment will create market opportunities for U.S. agricultural and forestry products that use climate-smart practices. Some of these practices include cost-effective ways to measure and verify greenhouse gas benefits. Read more about this initiative here.
In Their Own Words
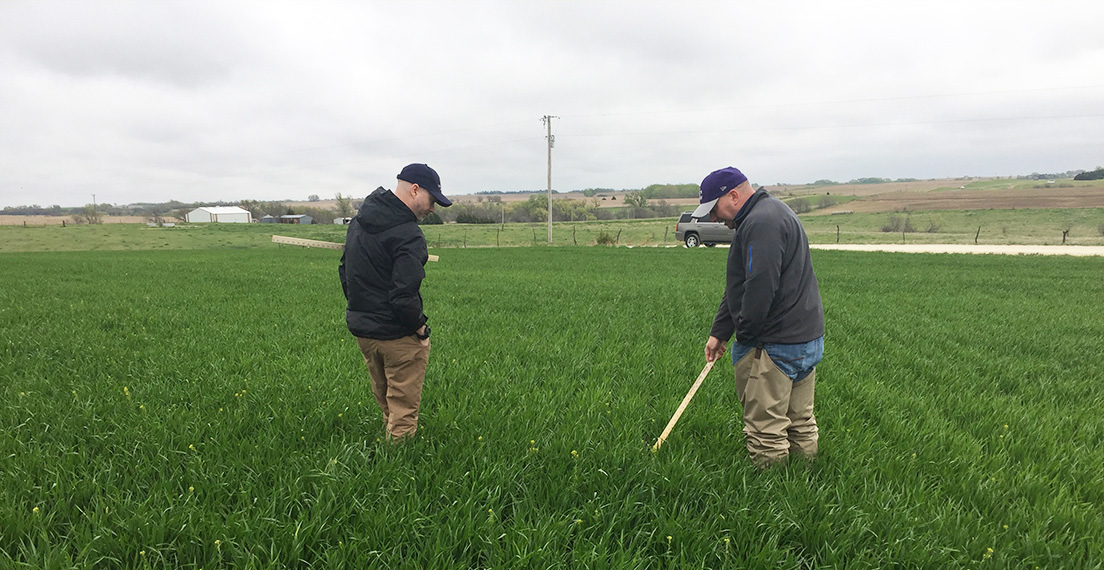
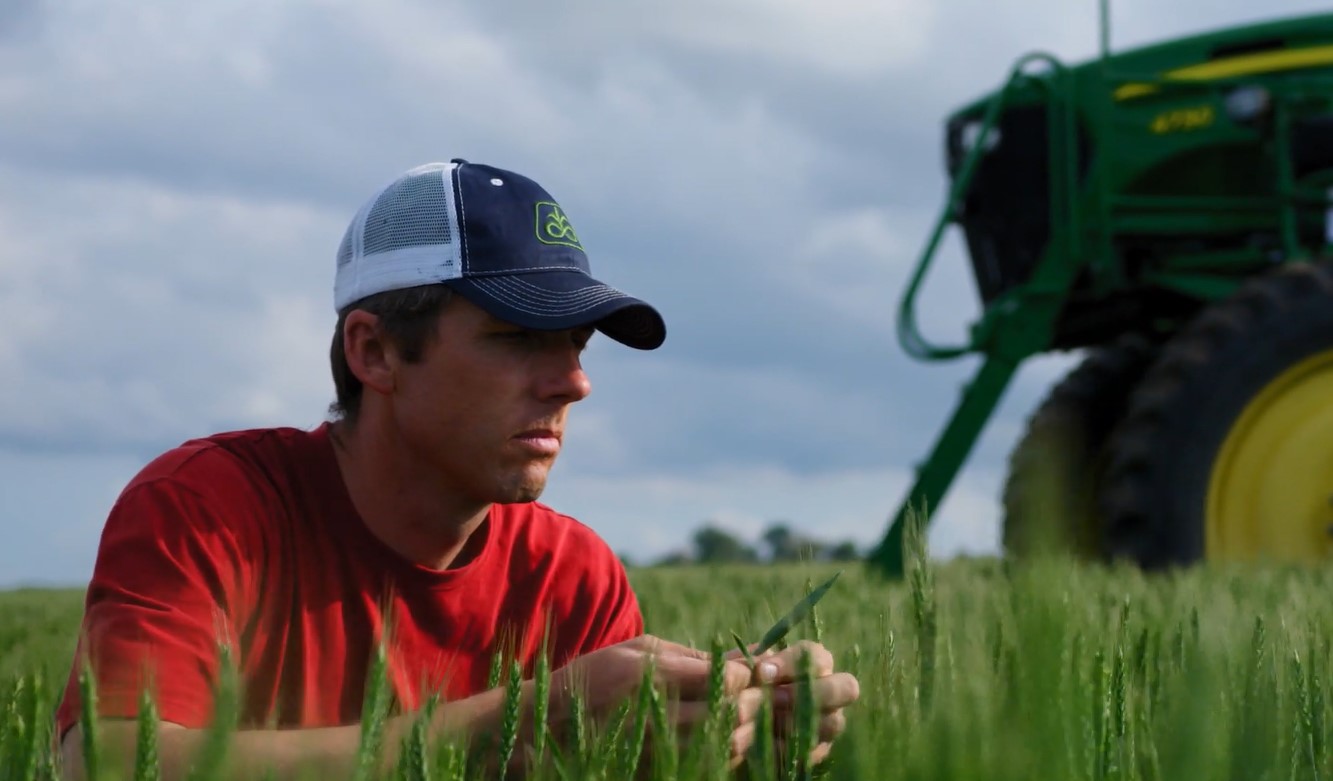
There are no more trusted sources about sustainable wheat production than from farmers themselves. As part of its “Wholesome: The Journey of U.S. Wheat” film, USW included this segment titled “Sustaining the Legacy.”
USW also shares the stories of how six farmers adapt to the challenges unique to their production region to make choices that are best for the environment and their operation. Learn more about their sustainable wheat production practices and how they work every day to contribute to a sustainable future in agriculture here.