thumbnail

By Stephanie Bryant-Erdmann, USW Market Analyst

USDA will issue its first 2017/18 world wheat supply and demand estimates in May, but on Jan. 19 the International Grains Council (IGC) provided an early look ahead at the next marketing year. IGC pegged 2017/18 world wheat production at 735 million metric tons (MMT), down 2 percent from the estimated 752 MMT produced in 2016/17. If realized, it would still be the third largest wheat crop ever, but would be the first year over year decline in 5 years. For comparison, USDA estimates 2016/17 global wheat production at 753 MMT.

IGC expects just two of the major exporting countries, Russia and Ukraine, to harvest more wheat in 2017/18, even though their estimates are up only 1 percent and 2 percent, respectively. IGC predicts European Union harvested area will remain stable in 2017/18. Harvested area is forecasted to fall 3 percent in Argentina, Australia and Canada, while IGC expects farmers in the United States and Kazakhstan to harvest 8 percent and 10 percent less wheat, respectively.

Harvested area in Morocco is expected to rebound to a more normal level after widespread rain eased drought conditions that cut its 2016/17 harvested area by 26 percent in 2016/17 to just 5.19 million acres (2.1 million hectares). Projected increases in India, North Africa, Turkey, Iran and Egypt will offset the expected decreases in harvested area among the major exporters according to IGC data.

2017/18 carry-in stocks are estimated at a record large 235 MMT, up 6 percent year over year, if realized. However, the larger carry-in stocks are not anticipated to offset the forecasted decrease in production, and total world supply would decline 3 MMT to a projected 970 MMT.

For the first time since 2012/13, IGC expects total consumption to be greater than total production. Total consumption is forecast at 737 MMT, down an estimated 1 MMT from 2016/17. Food use will climb over 500 MMT for the first time ever, partially offsetting an expected decrease in feed and residual use due to smaller production in Canada and the United States.

IGC believes 2016/17 world wheat trade will shrink to 164 MMT, down 4 percent from the prior year, if realized. With consumption outpacing production, IGC expects carryout stocks to decrease marginally year over year to 234 MMT.

thumbnail

Through advancements in agriculture and the development of new crop varieties, humans have historically strived to meet the needs of a growing population and to develop a safe, reliable and sustainable food supply. How will we continue to meet this challenge, while dealing with a changing climate and threats of new pests and diseases? The American Seed Trade Association (ASTA) affirms that continued innovation is paramount to the future of agriculture and to our shared quality of life. Plant breeders including those who develop new wheat varieties will need access to available tools to responsibly meet these challenges.

The fundamental practices of plant breeders have not changed over time, ASTA notes. Plant breeders still select the best plants for their desired goal, which may be higher yields, disease resistance, improved end use characteristics or better nutrition. However, the tools and information that plant breeders use have evolved, allowing them to take advantage of the growing understanding of plant science and genetics. Today, with the capability to sequence plant genomes and the ability to link a specific gene or genes to a specific characteristic, breeders are able to more precisely make improvements in plant varieties. Breeders can also make specific changes in existing plant genes in ways similar to changes that could occur in nature.

Innovative breeding methods include a variety of tools that mimic processes that have been used in traditional breeding since the early 20th century. ASTA reports that breeders may opt to use the newer methods rather than classical breeding to reach the same endpoint more accurately and efficiently. As with more traditional breeding methods, some of the newer methods focus on using a plant’s own genes, or genes from the plant’s wild relatives, to create a desired characteristic, such as disease resistance or drought tolerance. It is a more precise way of creating genetic variation — a longtime goal of plant breeders. To read more about innovations in wheat breeding, visit https://www.heartlandinnovations.com/about-us/kansas-wheat-innovation-center.

It is important to note that seeds are comprehensively regulated by USDA. A key feature of the plant breeding process is extensive testing and evaluation starting early in the process and continuing until the final product is commercially available. These tests are based on procedures breeders have used for many decades to create new plant varieties that are safe to grow and eat.

The world’s farmers and food manufacturers understand that America’s agriculture producers face the very real challenge of providing for a growing population so future generations have access to the same diverse, nutritious and high quality food we enjoy today. ASTA believes improved breeding methods will help meet these needs more efficiently and economically through agriculture practices that preserve natural resources and biodiversity. These new breeding methods are accessible to both public and commercial plant breeders in developed and developing countries, and they can be used across all agriculturally important crops, including food, feed, fiber and fuel crops.

thumbnail

By Amanda J. Spoo, USW Communications Specialist

Every year USW sends teams of U.S. farmers overseas to visit markets they supply with wheat. These regional visits highlight the day-to-day work and marketing strategies of USW’s overseas offices and connect the farmers to their customers and industry stakeholders.

“The feedback we hear consistently from our customers is how much they appreciate getting to know the farmer firsthand,” said USW Vice President of Overseas Operations Vince Peterson. “These team visits give farmers the opportunity to follow their wheat overseas, and as businessmen and women, those personal connections are invaluable.”

USW Communications Specialist Amanda Spoo will lead USW’s 2017 South Asia Board Team to Thailand and the Philippines in February. The team includes Dustin Johnsrud, a wheat farmer from Epping, ND, serving his first four-year term on the North Dakota Wheat Commission; Denise Conover, a wheat farmer from Broadview, MT, and a director on the Montana Wheat and Barley Committee; and Clint Vanneman, a wheat farmer from Ideal, SD, and a current USW director representing the South Dakota Wheat Commission.

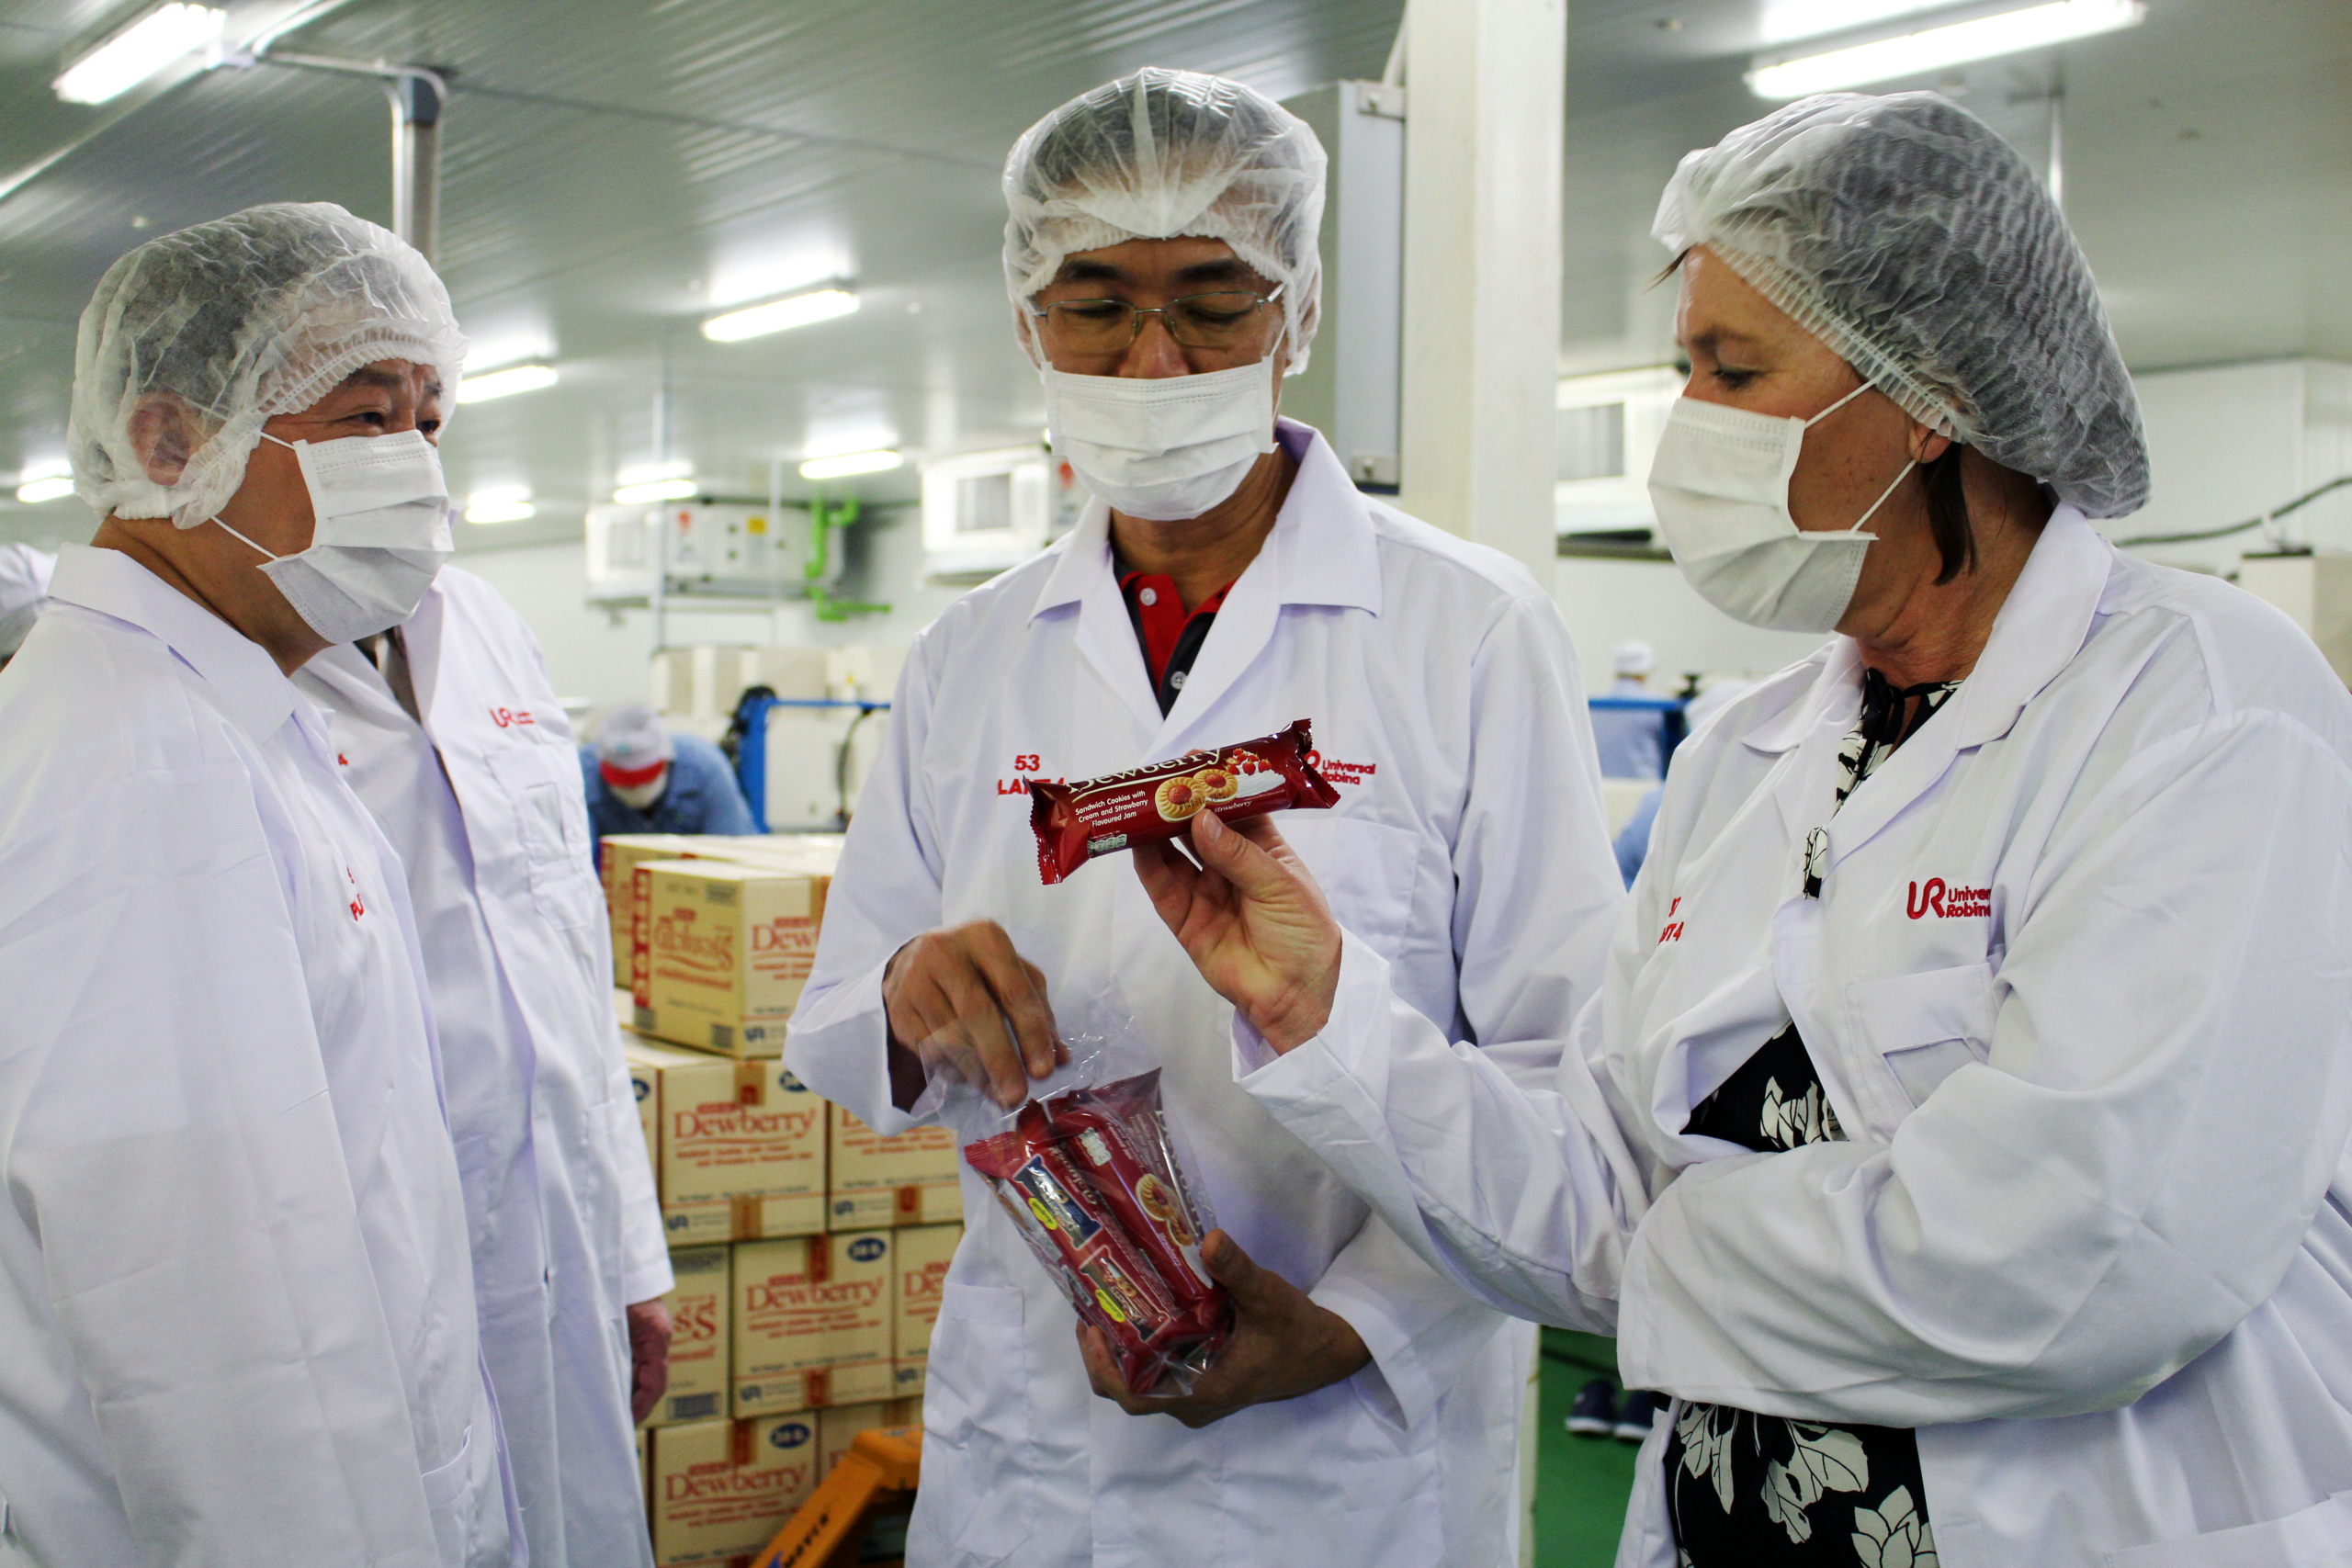
The team will first meet at the USW West Coast Office in Portland, OR, for briefings by USW and the Wheat Marketing Center, as well as visits to the Federal Grain Inspection Service and the local United Grain export terminal. During three days in Thailand, the team will visit the United Flour Mills (UFM) Baking and Cooking School as well as tour a flour mill, a bakery and an international food manufacturing plant. The second leg of the trip features two days in the Philippines, which includes tours of a mill and a food manufacturer. The team will also have the opportunity to attend the Filipino-Chinese Bakery Association Inc. (FCBAI) Bakery Fair.

The Thai milling wheat market has grown at a robust 5 percent for the past two years. USDA estimates that milling wheat demand reached 1 MMT for the first time in the 2012/13 marketing year and has increased to 1.24 MMT in 2016/17. Customers there imported about 50 percent of their milling wheat from the United States in 2015/16. In an evolving Thai market, consumer preferences are changing and there is increased demand for baked goods, biscuits and noodles. Over the past four decades, USW has worked closely with the UFM Baking and Cooking School in Bangkok to train and provide technical assistance to South Asian bakers and demonstrate the quality and value of U.S. wheat classes.

The Philippines was the third largest buyer of U.S. wheat in the 2015/16 marketing year with total imports reaching almost 2.2 MMT and was the largest buyer of both soft white (SW) and hard red spring (HRS). In this dynamic market, USW continues to help the milling and baking industry navigate changes by providing technical assistance and marketing training, and investing in activities to increase wheat flour consumption. USW established an office in Manila in 1961, allowing USW to maintain close, long-term relationships with industry leaders in the Philippines.

“Visiting these markets will give the farmers a unique look at the value of using high quality U.S. wheat and why these markets prefer it for their end-products,” said Peterson.

The team will post regular travel updates and photographs, and will report to the USW board. Follow their progress on the USW Facebook page at www.facebook/uswheat and on Twitter at @uswheatassoc.

thumbnail

In 2015, The Center for Food Integrity (CFI) shared the results of ongoing research showing U.S. consumers want more and more information about their food and primarily expect food companies to provide it. Those U.S. consumers surveyed also look to farmers for information about food.

CFI’s research shows being more transparent about food commodities and products builds consumer trust as well as a greater understanding of the challenges and opportunities facing the U.S. food system.

USW is sharing this information because in a broader sense, U.S. research can give the world’s commercial flour millers and wheat food manufacturers information about how consumer attitudes may evolve in their countries.

CFI took its 2016 research to a new level with an innovative methodology called digital ethnography. Charlie Arnot, CFI’s chief executive officer, said in a release that the new research offers much deeper insights into distinct groups whose actions about where they buy food, or how they form opinions about products, processes, people and brands, influence the decisions of others.

This emerging influence is why more U.S. consumers are flocking toward the things about today’s food that they believe is more sophisticated and represents “progressive” production, CFI noted. Arnot said this is seen in increased demand for food that is less processed, with simple labels that describe what is in, and what is not in, the products. USW see a relevant example for the world’s millers and bakers in the sponge and dough bread production method, using only flour, yeast and water, compared to “no-time” bread production that requires more additives and conditioners. Innovations in plant breeding may also be a resource for consumer questions.

“Understanding consumer attitudes toward food and how those attitudes influence the conversation allows food companies to more effectively talk with consumers,” said Leigh Horner, vice president, communications at The Hershey Company. “Consumers want to feel good about the products they buy for themselves and their families and want easy access to balanced, useful information to know they are making the right choices. These insights will help food companies build trust … and engage in meaningful conversations about the food their customers buy.”

The Center for Food Integrity is a not-for-profit organization that helps today’s food system earn consumer trust. Our members and project partners, who represent the diversity of the food system, are committed to providing accurate information and working together to address important issues in food and agriculture. The Center does not lobby or advocate for individual companies or brands. For more information, visit www.foodintegrity.org.

thumbnail

By Stephanie Bryant-Erdmann, USW Market Analyst

The USDA pegged 2016/17 world wheat production at 753 MMT (27.6 billion bushels), up 2 percent from 735 MMT (27.0 billion bushels) in 2015/16 and 6 percent above the 5-year average. If realized, it would be the fourth consecutive year of record wheat world production. USDA projects production will increase in seven of the eight major exporting countries. The only exporter with decreased production is the European Union.

Record-large world carry-in stocks add to the global surplus, resulting in the largest estimated world wheat supply on record. USDA estimates 2016/17 world carry-in stocks at 240 MMT (8.84 billion bushels), up 11 percent from last year and greater than the 5-year average of 197 MMT (7.25 billion bushels). Total world supply will reach a projected 993 MMT (36.5 billion bushels), up 40.4 MMT from the record set in 2015/16. The ample world supply will help meet strong global wheat demand.

USDA expects total consumption will increase for the fourth consecutive year and reach a record 740 MMT (27.2 billion bushels), compared to 712 MMT (26.2 billion bushels) in 2015/16. Feed wheat use is predicted to grow an estimated 6 percent to a record high 147 MMT (5.42 billion bushels) due to increased global supplies of feed wheat after rain increased yield in nearly every producing region (with western Europe a notable exception) but hurt quality.

USDA expects 2016/17 world wheat trade to grow to a record large 178 MMT (6.54 billion bushels). If realized, it would be 11 percent greater than the 5-year average of 160 MMT (5.86 billion bushels).  USDA expects world carry-out stocks to increase 12.8 MMT (470 million bushels) year over year to 253 MMT (9.31 billion bushels), 23 percent greater than the 5-year average of 206 MMT (7.56 billion bushels).

thumbnail

By Stephanie Bryant-Erdmann, USW Market Analyst

U.S. farmers made critical decisions last fall while they had bins full of wheat from record-breaking yields with prices near ten-year lows. Therefore, it is no surprise that many farmers chose to decrease their winter wheat planted area. USDA’s 2017/18 winter wheat seeding report released Jan. 12 reported U.S. farmers planted the second lowest number of winter whea­­t acres on record and 10 percent fewer acres than 2016/17. USDA estimated U.S. farmers planted 32.4 million acres (13.1 million hectares) of winter wheat with reductions for all three classes of winter wheat — HRW, soft red winter (SRW) and white winter wheat.

USDA assessed HRW planted area at 23.3 million acres (9.43 million hectares), down 12 percent from 2016. Planted area in Kansas, the number one U.S. HRW-producing state at 7.40 million acres (3.00 million hectares), is down 13 percent from 2016 and 20 percent below the 5-year average. Nebraska farmers planted a new record low area to winter ­­wheat of just 1.09 million acres (441,000 hectares), 25 percent below the 5-year average.

Total SRW planted area of 5.68 million acres (2.30 million hectares) fell 6 percent from 2016. Increases in Delaware, Georgia, Kentucky, Maryland, North Carolina and South Carolina were not enough to offset decreases in most of the other SRW-producing states, including a 16 percent decline in Ohio, the number one producer of U.S. SRW in 2016/17. USDA believes Ohio farmers planted 490,000 acres (198,000 hectares) of SRW, 15 percent below the 5-year average.

White winter wheat planted area decreased to 3.37 million acres (1.36 million hectares), down 4 percent from 2016/17. Exportable soft white wheat supplies are concentrated in Idaho, Oregon and Washington. Planted area in Idaho and Oregon fell 4 percent and 3 percent, respectively. Idaho farmers planted 730,000 acres (295,000 hectares) compared to 760,000 acres (308,000 hectares) in 2015/16 and 2016/17. Planted area in Oregon dropped 20,000 acres (8,000 hectares) from 2016/17 to 700,000 acres (283,000 hectares), while planted area in Washington remained stable year over year at 1.70 million acres (688,000 hectares).

Durum planting in the Southwestern United States is estimated at 140,000 acres (56,700 hectares), down 8 percent from 2016/17 and 38 percent below 2015/16. According to USDA, planting is well underway in Arizona at 22 percent complete, up 8 percentage points from the same date last year. Delays from wet conditions are slowing progress in California. Arizona and California plant durum from December through January for harvest in May through July.

With the decrease in planted area in the United States, customers should pay close attention to weather maps and consider purchasing farther out to protect themselves from supply shocks.

thumbnail

By Ben Conner, USW Director of Policy

Next week, the United States will hold its quadrennial pageantry to mark the beginning of a new presidential term. Since term limits prevented President Obama from running again, his administration will come to an end.

The wheat industry has not always seen eye to eye on every issue with the Obama Administration, but on trade policy there has been a great deal of common ground. As the Obama years draw to a close, it is worth reflecting on the trade policy accomplishments of this Administration.

The first major trade policy accomplishment of interest to wheat was finishing the agreements with Colombia, Panama and South Korea that were negotiated during the George W. Bush Administration, which were passed by Congress and signed into law in 2011. Tariffs for wheat went to zero as soon as the agreements entered into force. This is especially important as some of U.S. wheat’s major competitors in Australia and Canada were also negotiating FTAs with these countries.

After these agreements were finished, the focus shifted to negotiating the two largest free trade areas in terms of GDP ever attempted — the Trans-Pacific Partnership (TPP) and the Transatlantic Trade and Investment Partnership (TTIP). These agreements are full of complexity due to the scope and the number of economies involved. TPP negotiations were completed in 2015 but have not been ratified by Congress. Its future is highly uncertain in the next Administration. TTIP has much further to go, but its delay has much to do with political dynamics in the European Union. Regardless of the ultimate outcome of these agreements, the Obama Administration can rightfully be proud of its ambitious free trade agenda.

One of the most high profile initiatives affecting wheat was the Administration’s reestablishment of diplomatic relations with Cuba and accompanying efforts to reduce the regulatory burdens around trade with that market. Cuba imports no U.S. wheat today, but could be a top 10 market with the end of the trade embargo. Unfortunately, the embargo is still in place and no U.S. wheat has been sold, but these actions to improve relations with Cuba were important first steps.

A major but often overlooked accomplishment is that this Administration finally put the brakes on the World Trade Organization’s (WTO) Doha agenda, which had long since stopped being a serious avenue for opening trade. There are some countries that will still insist that Doha needs to continue, but any real prospect of reviving those negotiations ended with the 2015 Nairobi Agreement. Another accomplishment of that agreement was a phased out end to export subsidies — historically a major source of distortion in global wheat trade.

Finally, there are the WTO cases launched against China’s excessive subsidies and its opaque tariff rate quota (TRQ) administration for wheat imports. These are two of the most significant trade cases ever taken on behalf of U.S. farmers (and, of course, Chinese consumers). USW is proud to have played a major role in getting those cases going and congratulates the Administration for filing them. The incoming Administration has pointed to trade agreement enforcement as one of its priorities, so we have every reason to believe these cases will be pressed to their conclusions.

These are the trade policy accomplishments that grab the headlines. There have been dozens of other actions taken on behalf of U.S. wheat farmers that facilitate sales, keep markets open and improve the global trading system. As the Obama Administration leaves and the Trump Administration begins, the wheat industry can be grateful that the exceptionally competent top career staff at the U.S. Department of Agriculture and U.S. Trade Representative will still be in their jobs on Jan. 21, continuing their efforts on behalf of U.S. agriculture.

Harvest Report

By Stephanie Bryant-Erdmann, USW Market Analyst

2016 ended on a high note for U.S. wheat exports, which posted the largest volume of sales in the fourth quarter since 2010. From October through December, the United States exported 6.5 million metric tons (MMT) of wheat, 48 percent above last year’s sales and 28 percent greater than the 5-year average. The strong export sales pace pushed total U.S. wheat exports to 20.9 MMT through Dec. 29, 7 percent ahead of the 5-year average and greater than total 2015/16 sales of 20.7 MMT.

Hard red winter (HRW) and hard red spring (HRS) are leading the charge. Year-to-date, HRW sales of 8.43 MMT are 24 percent ahead of the 5-year average and already greater than both 2015/16 and 2014/15 total sales. U.S. HRS sales are also 31 percent ahead of the 5-year average at 6.78 MMT and just shy of last year’s total 2015/16 sales of 6.91 MMT. These sales allowed the United States to regain the title of the largest single-country exporter in volume and value in a calendar year from Canada. According to USDA export sales data, U.S. wheat exports totaled 25.9 MMT, up 27 percent from CY 2015.

In CY 2015, Canada exported roughly 2.3 MMT more wheat than the United States and Russia, which nearly tied with a difference of less than 30,000 MT between them, based on Global Trade Atlas (GTA) data. The extra tonnage boosted the value of Canadian wheat exports to $6.23 billion compared to the U.S. wheat export value of $5.62 billion and the Russian value of $3.95 billion. In other words, despite the United States and Russia being virtually tied for the number two spot by tonnage in CY 2015, U.S. wheat exports earned 42 percent more dollars.

This year, the value comparison is even more interesting. GTA data shows U.S. wheat exports back on top from January to November with a value of $4.88 billion. For the same time period, GTA estimates Canadian wheat export value at $4.13 billion and Russian wheat export value at $3.32 billion.

While industry reports tend to focus on tonnage for grains, reports concerning other crops often refer to value of exports. While volume of exports reflects the drawdown of available stocks and infrastructure utilization, the value of exports reflects the relative financial return to the various exporting country economies as well as to producers and grain handlers.  International Grains Council (IGC) data shows the export price of Canadian 13.5 percent protein (on a 13.5 percent moisture basis) spring wheat at Vancouver averaged $218/MT ($5.93/bu) in 2016, and Russian milling wheat averaged $179/MT ($4.87/bu). By comparison, U.S. hard red spring (HRS) 13.0 percent protein (on a 12.0 percent moisture basis) at the Pacific Northwest averaged $232/MT ($6.31/bu) in 2016.

With many of the world’s largest exporters producing record-large crops with lower than normal protein content this year, buyers around the world are looking for high-quality, higher protein wheat. As the fourth quarter sales show, the U.S. wheat store continues to supply customers with the wheat they need. Customers around the world see the value of U.S. wheat versus its competitors and rely on it to provide consistent high quality flour to their own customer demand.

thumbnail

By Stephanie Bryant-Erdmann, USW Market Analyst

As the Dec. 9 World Agricultural Supply and Demand Estimate (WASDE) confirms, global wheat supplies are at a record high this year. USDA increased its estimate for 2016/17 global wheat production to 751 million metric tons (MMT), up 2 percent from 2015/16 and 6 percent above the 5-year average. USDA now forecasts Australian wheat production to reach a record 33.0 million metric tons (MMT), up 35 percent year over year, if realized.

Higher yields tend to be associated with lower protein. As discussed in the Nov. 3 Wheat Letter, quality test results from Stratégie Grains, UkrAgroConsult, Canadian Grain Commission and other international agricultural groups show lower-than-average protein in the supplies from wheat-exporting countries.

Lower average protein content is problematic for many end-users. According to work done by Shawn Campbell, USW Deputy Director, West Coast Office, nearly all of the world’s high protein wheat exports (13 percent protein on a 12 percent moisture basis or higher) originate from just six countries: Australia; Canada; Kazakhstan; Russia; Ukraine; and the United States. High protein wheat production in these countries accounts for an average one-fifth of their total production in a normal year.

High protein wheat supply and demand factors are driving the growing premium between the Minneapolis Grain Exchange (MGEX), which trades hard red spring (HRS), and the Chicago Board of Trade (CBOT) and Kansas City Board of Trade (KCBT), which trade soft red winter (SRW) and hard red winter (HRW), respectively. Last December the intermarket spread between MGEX and KCBT averaged 36 cents. Fast forward to this December, and the MGEX to KCBT spread averages $1.47.

If the same high-yield, lower-than-average protein correlation also plays out in Australia, there will be little help from that corner for buyers searching for high protein wheat, further supporting the MGEX to KCBT and MGEX to CBOT spreads.

The demand for higher protein wheat also supports HRW protein spreads, which have widened significantly this year at both Gulf and Pacific Northwest (PNW) ports. Over the past 15 years, the average premium for 12 percent protein (12 percent moisture) at the Gulf has been 12 cents per bushel. This year that premium is 46 cents per bushel. The 15-year average premium for 12 percent protein HRW at the PNW is $1.05 per bushel. Since the beginning of the 2016/17 marketing year on June 1, that average premium is $1.64 per bushel.

Despite the increasing premiums for higher protein HRW and HRS, U.S. HRW exports are 25 percent ahead of the 5-year average and U.S. HRS exports are 29 percent ahead of the 5-year average. While the average protein content of HRW exports this year is down from last year due to increased demand for all HRW, 12 percent protein shipments account for 31 percent of all HRW shipments to date, up from 27 percent last year. The brisk pace of HRW and HRS exports and anecdotal reports from traders indicate buyers are breaking from the hand-to-mouth buying pattern that has been prevalent this past year to secure supplies of higher protein wheat. Forward contracting for high protein needs now makes sense.

When evaluating competing prices of high protein wheat, buyers should be sure to convert protein values quoted to a common moisture basis. Because water can be readily removed (by drying) or added (by tempering), exporters quote protein using a fixed moisture basis, but they do not all use the same basis. The United States specifies protein on a 12 percent moisture basis. The European Union and the Black Sea region typically use a dry-matter (0 percent) moisture basis. Australia uses an 11 percent moisture basis and Canada uses a 13.5 percent moisture basis. Below is an example of how moisture basis impacts actual protein received, and the conversion equation.

Please call your local USW representative if you have any questions about the U.S. wheat marketing system, U.S. wheat supply or moisture basis calculations.

Country Moisture basis used Example: 13% Protein Protein Converted to

Dry-Matter Basis

Australia 11.0 13.0 14.6
Black Sea 0.0 13.0 13.0
Canada 13.5 13.0 15.0
European Union 0.0 13.0 13.0
United States 12.0 13.0 14.8

Equation to calculate protein content based on different moisture basis:

Example: You have a sample of wheat with 10 percent protein on a 13 percent moisture basis (mb) and want to convert to 12 percent mb.

Equation:    Protein1/(100-mb1) = Protein2/(100-mb2)

10/(100-13) = Protein2/(100-12)

10/87=Protein2/88

Protein2= (88*10)/87 = 10.1%

thumbnail

By Ben Conner, USW Deputy Director of Policy

On Nov. 8, 2016, American voters shocked the world and themselves by electing Donald J. Trump to be the 45th President of the United States. To those who trade goods and services across the U.S. border, including wheat buyers, this may be cause for some alarm because of statements made by the President-elect over the past year.

This is, however, no time to panic. The U.S. wheat store will remain open. The President-elect has yet to enact a single policy, and campaign rhetoric always seems to have a way of adjusting to reality, particularly after a year where rhetorical flourishes played such an outsized role on the campaign trail.

And here is the reality. Much of the U.S. economy depends on a rules-based trading system, including free trade agreements (FTAs) and the World Trade Organization (WTO) agreements. All those agreements have provisions to prevent a country from giving special privileges to their producers.

The reason for that is simple enough: special privileges backfire because other countries impose their own special privileges in response. Sets of rules that create a level playing field, such as a trade agreements, allow people in each country to buy and sell without interference based on their own skills and preferences.

The network of trade agreements to which the United States is party — including NAFTA, CAFTA, the six Trans-Pacific Partnership (TPP) member countries that have existing FTAs with the United States, and the WTO — is integral to the function of the U.S. economy, because so many jobs are in whole or part dependent on international trade.

Wheat is the most export dependent grain grown in the United States and our overseas customers rely on its quality, consistency and reliability of supply. New and existing trade agreements are major contributors to the profitability of U.S. wheat farmers and their customers.

It is difficult to appreciate the scale of that dependence and the ramifications of threats to pull out of agreements or impose WTO-inconsistent punitive tariffs should any of those actually occur. However, it is interesting to see the path one formerly protectionist president took toward more open trade. President William McKinley, once one of this country’s most ardent protectionists, told a crowd shortly before his death: “Commercial wars are unprofitable. A policy of goodwill and friendly trade relations will prevent reprisals. Reciprocity treaties are in harmony with the spirit of the times; measures of retaliation are not.”

It will never be too late for President-elect Trump to come to this same conclusion. Despite his disappointing promise to pull out of the TPP, he is already advocating new bilateral trade agreements (it is worth noting that TPP is essentially a collection of bilateral agreements with some shared language).

Fundamentally altering the interests of the U.S. economic and political systems is much easier said than done. So if you are worried about the continued commitment of the United States to the global trading system, cheer up: the campaign is behind us. The work of governing comes next.