2020 Hard Red Spring Crop Boasts Excellent Qualities and Soundness
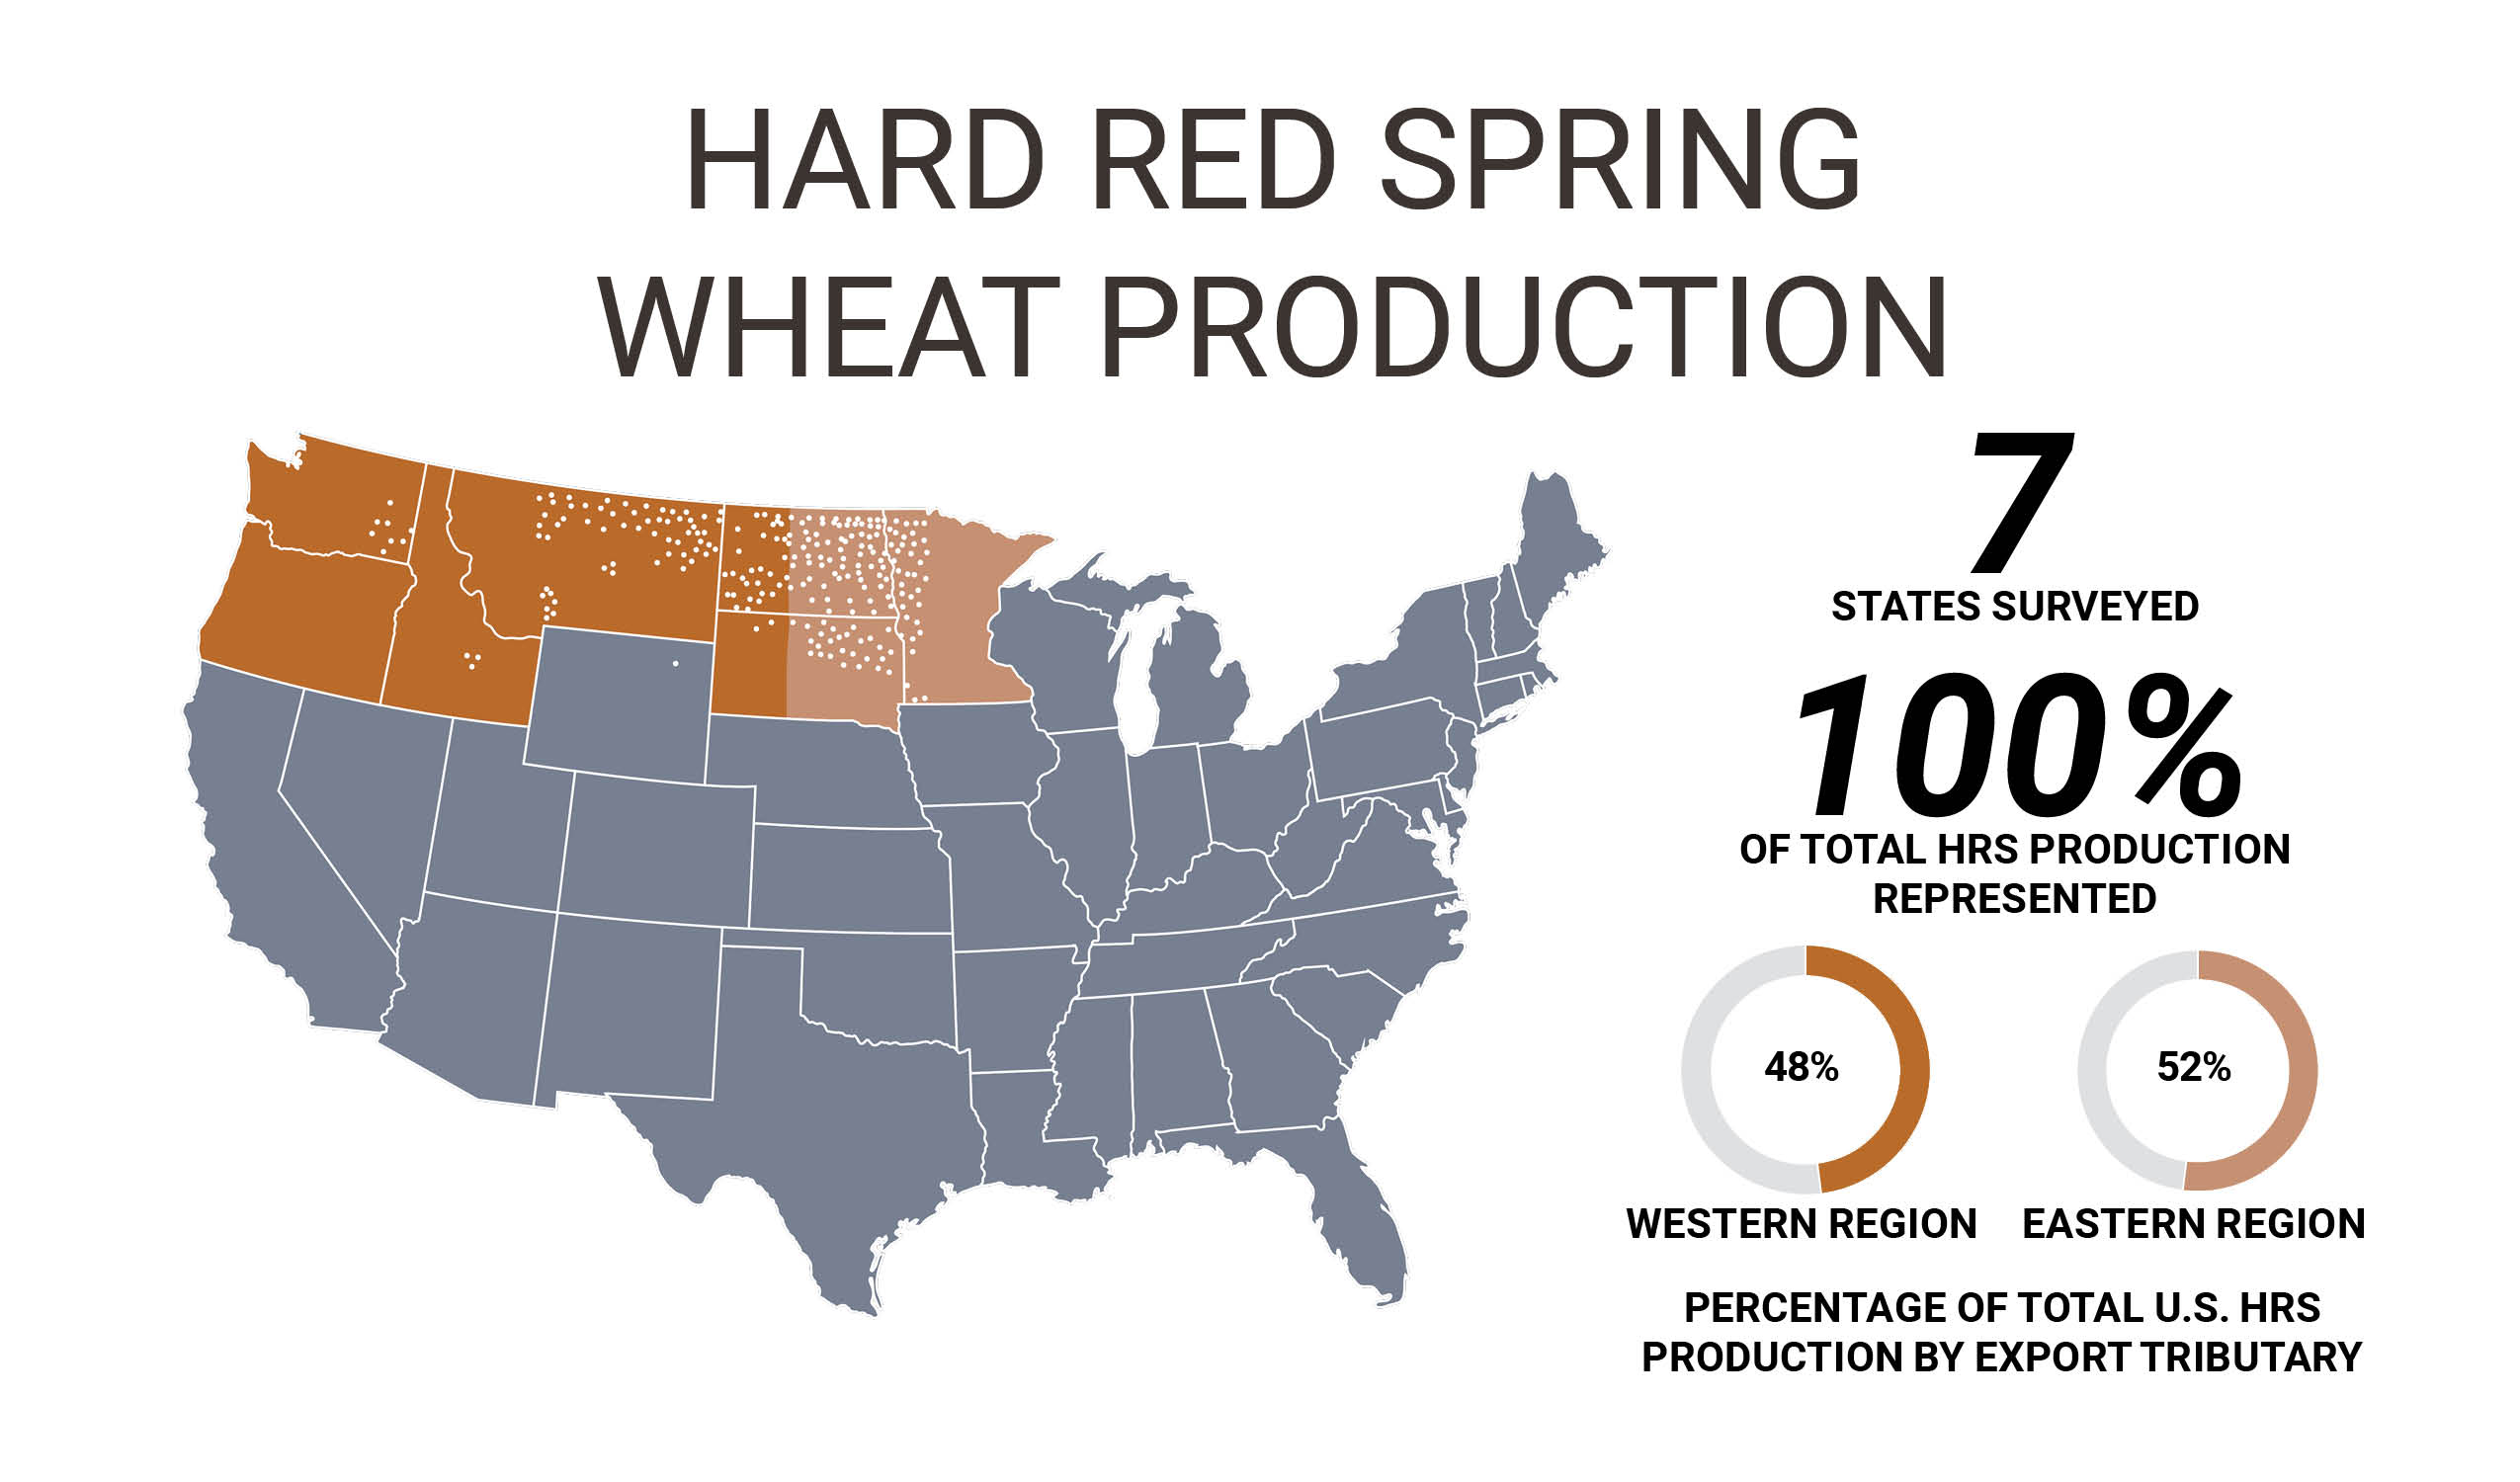
The 2020 U.S. hard red spring (HRS) wheat crop boasts excellent kernel and grade qualities, with significantly improved kernel soundness compared to 2019. The crop had significantly higher vitreous kernel and falling number values. The crop shows less extensibility and more resistance compared to 2019, but similar to the 5-year average. Other quality factors include improved dough strength with very high bread scores. With above-average supplies and high-quality parameters, the 2020 U.S. HRS crop offers excellent value to buyers.
U.S. Wheat Associates (USW) has posted the full 2020 Hard Red Spring Wheat Quality Report on its website here.
Cool temperatures slowed planting and emergence in parts of the growing region. Timely mid-season rains and a dry, rapid harvest period limited disease pressures and benefitted kernel quality parameters. USDA estimates production at 14.4 million metric tons (MMT), slightly higher than the 2019 crop on reduced planting area.
Here are a few highlights from the 2020 HRS wheat crop.
Wheat and Grade Data:
- Grade– the average grade on the 2020 samples is a No. 1 Northern Spring (NS).
- Test Weight average of 61.8 lb/bu (81.3 kg/hl) is higher than 2019 and 5-year averages.
- Vitreous kernel levels (DHV) are notably higher, with overall samples averaging 71%. Nearly two-thirds of the Western samples make the Dark Northern Spring (DNS) subclass.
- Wheat Protein averages 14.3% (12% mb) protein, similar to 2019 and 5-year averages.
- DON average is 0.2 ppm, down from 0.6 in 2019.
- 1000 Kernel Weight average is 31.5 g, heavier than 2019 and 5-year averages, due to good kernel fill conditions.
- Wheat Falling Number average is 374 sec, a vast improvement in kernel soundness across the crop.
Flour, Dough and Baking Data:
- Laboratory Mill Flour Extractions average 67.4%, lower than 2019 and 5-year averages.
- Flour ash was similar to 2019 at 0.52%, while flour color showed higher L* color scores in both regions.
- Flour Wet Gluten Contents average 33%, lower than both 2019 and 5-year averages.
- Amylograph values average 642 BU for 65 g of flour, sharply higher than 2019.
- Farinograph indicates the crop has lower absorption compared to last year and 5-year averages. The average farinograph stability is 12.1 min, significantly stronger than 2019 and the 5-year averages.
- Alveograph P/L ratio average is 0.59, similar to 2019, but lower than 5-year average and the W-value increased to 368 (10-4 J), up from 2019.
- Extensograph analyses shows less extensibility and more resistance compared to 2019, but similar to 5-year averages. The overall extensibility and resistance to extension of the 135 min extensograph are 12.8 cm and 856 BU, with slightly more extensibility across Eastern areas.
- Loaf volume average is 973, smaller than 2019, but similar to 5-year averages. Average bake absorption is 67.4%, higher than 5-year averages. Bread scores are similar in both regions in 2020, with Western area slightly lower than a year ago while the Eastern area is slightly higher.
View other summaries of the 2020 U.S. wheat crop:
Hard Red Winter
Hard White
Soft White
Soft Red Winter
Durum
View the full 2020 U.S. Crop Quality Report and other related resources here.


